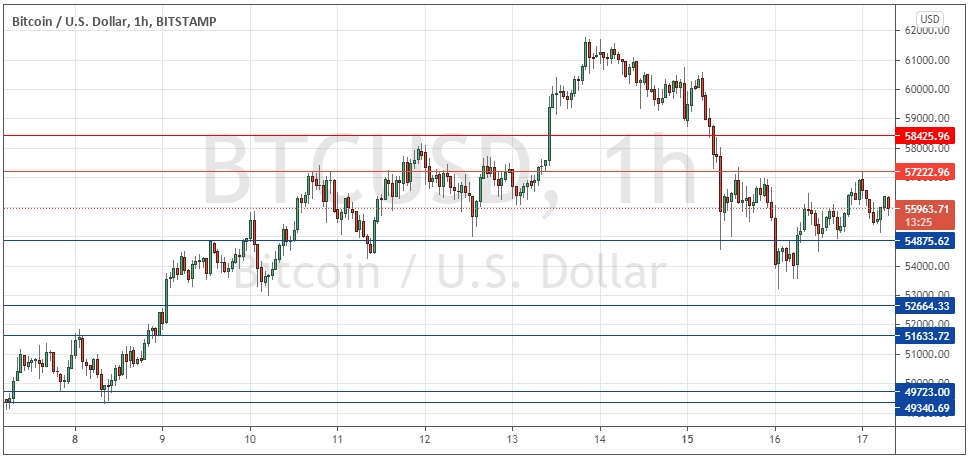
Last Monday’s Bitcoin signals were not triggered, as none of the key levels identified were reached that day.
Today’s BTC/USD Signals
Risk 0.50% per trade.
Trades may only be entered prior to 5pm Tokyo time Thursday.
Long Trade Ideas
Long entry after a bullish price action reversal on the H1 time frame following the next touch of $54,876, $52,664, $51,634, $49,723, or $49,340.
Put the stop loss $100 below the local swing low.
Adjust the stop loss to break even once the trade is $100 in profit by price.
Remove 50% of the position as profit when the trade is $100 in profit by price and leave the remainder of the position to ride.
Short Trade Idea
Short entry after a bearish price action reversal on the H1 time frame following the next touch of $57,223 or $58,426.
Put the stop loss $100 above the local swing high.
Adjust the stop loss to break even once the trade is $100 in profit by price.
Remove 50% of the position as profit when the trade is $100 in profit by price and leave the remainder of the position to ride.
The best method to identify a classic “price action reversal” is for an hourly candle to close, such as a pin bar, a doji, an outside or even just an engulfing candle with a higher close. You can exploit these levels or zones by watching the price action that occurs at the given levels.
BTC/USD Analysis
I wrote last Monday that following the strong downwards movement, if the price continued down and reached the nearest support level at $52,664 it was likely to produce a bullish bounce and perhaps even another strong rise back up to the $60k area and beyond.
The price has still not yet reached $52,664 so this call was not very applicable, although we have seen a low since then just above $53K which was close to this level.
We are now seeing the price get established below a new lower resistance level at $57,223 which is a sign of a more bearish picture, but we have also seen a support level at $52,664 making its presence felt and holding up. Therefore, it makes sense to conclude that bulls and bears are quite evenly matched, and the price is likely to consolidate over the short term between these two levels, meaning the best trading opportunities here today will be likely to be from reversals at either level.
We are also seeing the near completion of a bearish head and shoulders pattern and, although the pattern is somewhat rough, it can still be valid. The neckline here will be at approximately $53k so a bearish breakdown below that round number area will be a significant bearish technical development if it happens.
Regarding the USD, there will be a release of the FOMC statement, rate, and economic projections at 6pm London time followed by the usual press conference half an hour later.

