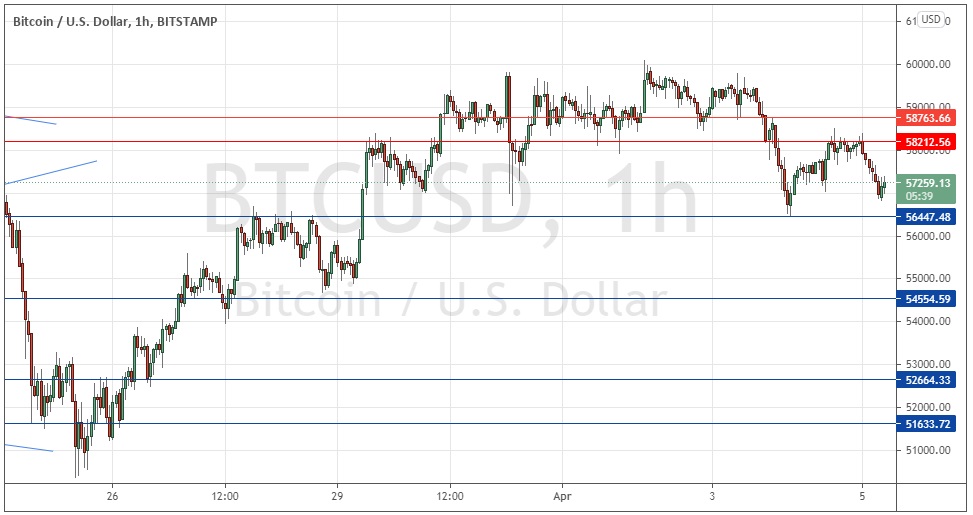
Last Wednesday’s Bitcoin signals were not triggered, as there was no bearish price action when the price first reached the resistance level identified at $58,424.
Today’s BTC/USD Signals
Risk 0.50% per trade.
Trades must be taken before 5pm Tokyo time Tuesday.
Long Trade Ideas
Go long after a bullish price action reversal on the H1 time frame following the next touch of $56,447 or $54,555.
Place the stop loss $100 below the local swing low.
Move the stop loss to break even once the trade is $100 in profit by price.
Take off 50% of the position as profit when the trade is $100 in profit by price and leave the remainder of the position to run.
Short Trade Idea
Go short after a bearish price action reversal on the H1 time frame following the next touch of $58,213 or $58,764.
Place the stop loss $100 above the local swing high.
Move the stop loss to break even once the trade is $100 in profit by price.
Take off 50% of the position as profit when the trade is $100 in profit by price and leave the remainder of the position to run.
The best method to identify a classic “price action reversal” is for an hourly candle to close, such as a pin bar, a doji, an outside or even just an engulfing candle with a higher close. You can exploit these levels or zones by watching the price action that occurs at the given levels.
BTC/USD Analysis
I wrote last Wednesday that as the price had dropped from a peak suddenly on high volatility, I saw this as a signal that directional movement had become very unpredictable, so I thought it would be wise to stand aside from any trend trades and instead look to trade any reversals at extremes.
The levels I identified did not hold when reached, so this did not generate a trade entry signal, but it was enough to keep out of trouble. Overall, I was correct about lack of direction as the price went on to consolidate for a couple of days before turning down.
The technical picture has become more bearish as we see recent topping out just below the big round number above at $60k followed by the printing of new lower resistance levels which are holding the price down and causing moderate bearish thrusts.
Both the resistance level at $58,213 and the support level at $56,447 look strong and pivotal, so a productive approach to trading Bitcoin today will likely be to wait for one of these levels to be broken and then to look to trade in the direction of the breakout.
Although there is a long-term bullish trend, I think we are more likely to see a meaningful breakout on the short side, so I will take a short bias if we get two consecutive hourly closes later below $56,447.
Concerning the USD, there will be a release of ISM Services data at 3pm London time today.

