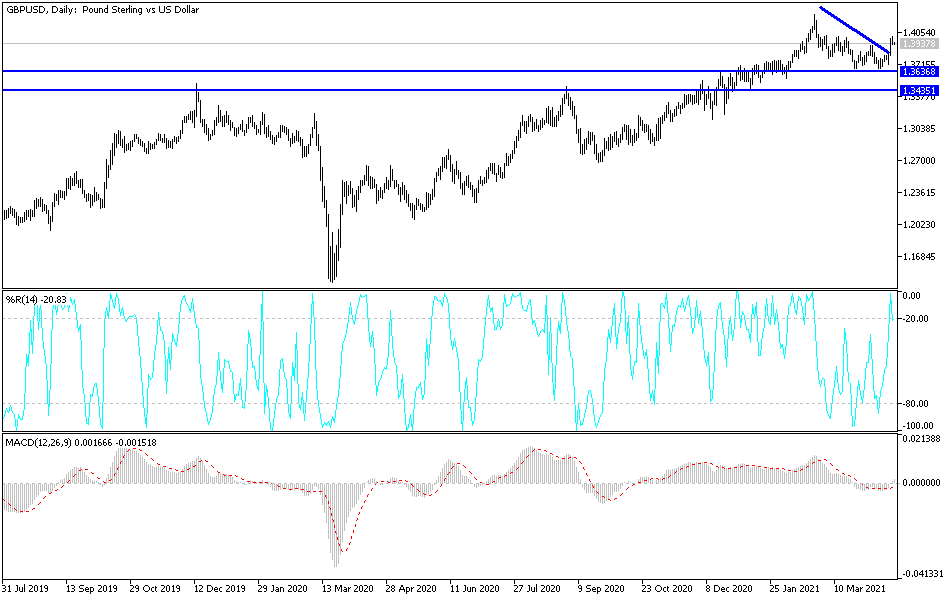
The 1.40 level has been like a brick wall for the British pound, and the fact that we have pulled back from the level on Tuesday should not be too much of a huge surprise, considering that we got there so quickly. The Monday candlestick was very bullish and may have gotten way ahead of itself. By doing so, it fails to keep the inertia up to break out to the upside, and it now looks as if we are going to continue to see the 1.40 level as a major hurdle to overcome. If we can break above that level, then it opens up the possibility of another 200-point move. If that happens, then I anticipate that we will see a lot of fresh money coming into the market to attack the 1.42 handle. The 1.42 handle has been massive resistance on the weekly chart, and I think overcoming that level would be a massive victory for the bulls, allowing the market to go looking towards 1.45 handle.
The US dollar is probably the biggest driver of this market, so pay close attention to the US Dollar Index, as it is trying to find a bit of a bottom near the 91 handle. At this point, the US dollar is being thrown around by the idea of the reopening trade, and the massive amounts of stimulus that are out there waiting to happen. It is a bit of a weird mix, because the United States is certainly outperforming most of the rest of the world, so while things are good there, they are not necessarily good in many other places.
We had broken above the massive downtrend line during the session on Monday, but I believe that we had just gotten a bit ahead of ourselves trying to break above the 1.40 handle. Eventually, though, I do think that we are going to make a serious attempt to get above there. As long as we do not take out the bottom of the candlestick from the Monday session, I do believe that the market will eventually rally through that resistance, but we may have a little further to go before the value hunters jump in and start picking this market up. You will probably need to trade more or less off the shorter-term charts, looking for a signal on something like an hourly chart.

