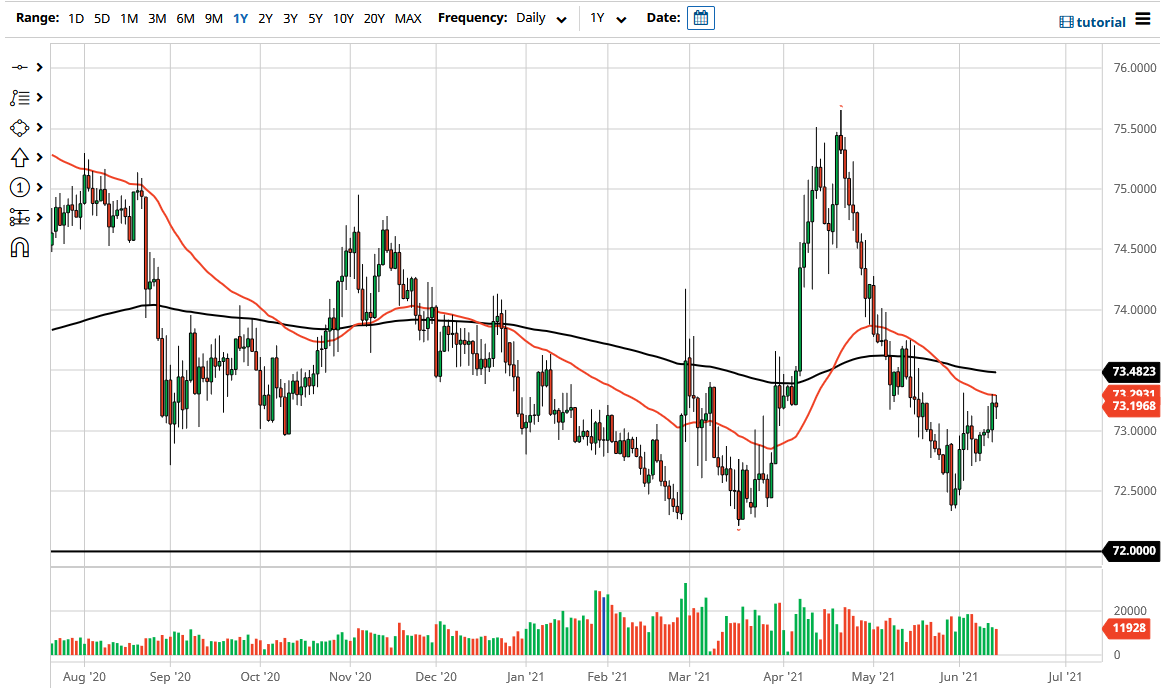
The Indian rupee initially fell during the trading session on Monday to kick off the week but has turned around to show signs of life again, as we did up forming a hammer. The 50-day EMA sits just above and could very well end up being resistance. If we can break above there, then it is likely that the US dollar will continue to take off to the upside, perhaps reaching towards the 200-day EMA, which is currently at the ₹73.43 level. Beyond that, if we can break above the 200-day EMA then it is likely that we could go looking towards the ₹74 level, where there would be a bit of previous resistance.
If we do break out above the 200-day EMA, it is more than likely going to send this market looking towards the ₹75.50 level over the longer term. India has been struggling with reopening much more than the United States has, so it does make sense that the greenback might get a little bit of a bid. With that in mind, it is also worth looking at the charts and recognizing that just below at the ₹72.25 level, there has been a massive amount of support multiple times over the last several months. Because of this, it looks like we are forming a base at what has been a crucial level more than once.
What is interesting about the candlestick that just formed for the Monday session is that it is a bit of a hammer, and it is pressing against psychological and technical resistance. In other words, it is almost certain that there are buyers underneath trying to push the pair higher and break through a significant amount of resistance. It will not be easy to do, so we have to keep in mind that if we break down below the ₹73 level, we could very well drop to ₹72.50 level. At this point, it is very obvious that we have a small range that we are banging around, and it is only a matter of time before we get some type of momentum flooding the market so that we can make a bit of a bigger move. I believe that the next major impulsive candlestick will lead the way.

