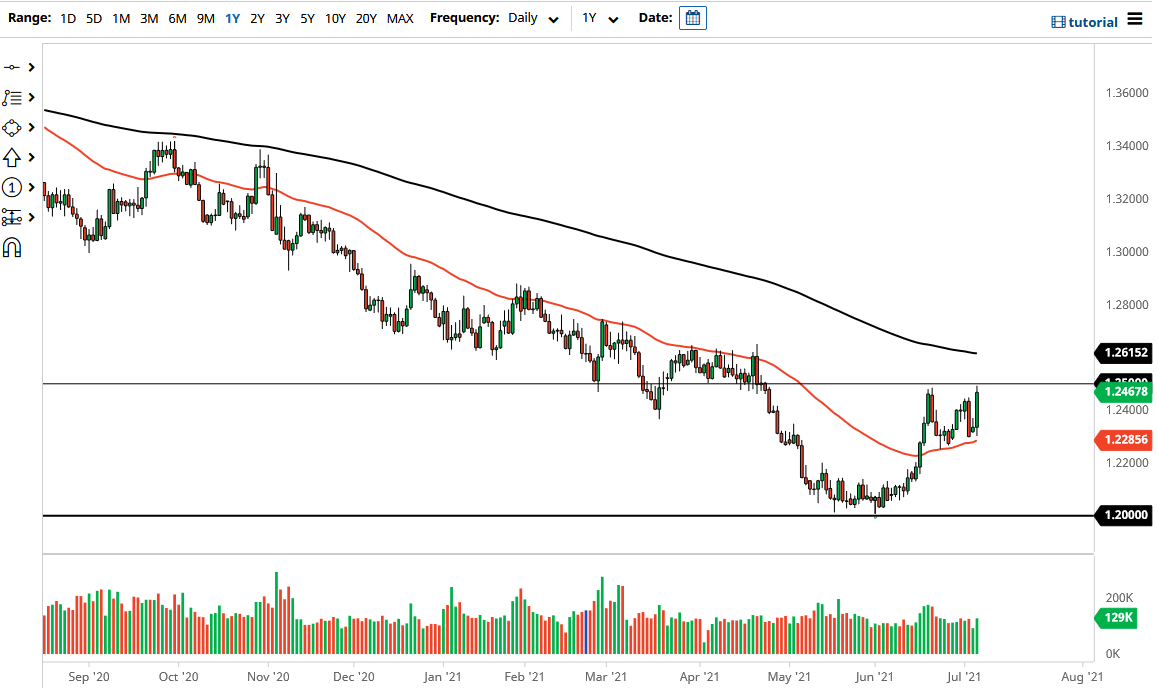
The US dollar rallied significantly during the trading session on Tuesday, using the 50-day EMA as a major support level. The market then shot straight up in the air towards the 1.25 handle, which is a major round figure that a lot of people will be paying close attention to. Beyond that, you can also see that the candlestick is rather bullish looking in and of itself, so I think it is likely that we could see a little bit of a bullish move just waiting to happen, and if we can clear the 1.25 level, it is very likely that we could go looking towards the 200-day EMA which is closer to the 1.26 level.
If we can break above the 200-day EMA, then most longer-term traders will take a close look at the market through the prism of an uptrend, and quite frankly we are getting dangerously close to having that happen. If the crude oil market were to roll over, that might be reason enough to make that a reality. Nonetheless, the US dollar has been rallying for a while even as oil has gained, so that does not necessarily mean it has to play out like that.
When you look at this chart, you need to look at it through the prism of the monthly timeframe which sees the 1.20 level as massive support. It is because of this that we may very well be looking at a recovery and a potential turnaround. This also jives quite nicely with the US Dollar Index, which also looks as if it is trying to recover. That being said, there is always the negative possibility as well.
If we were to turn around and break down below the 50-day EMA, then I think the market probably goes looking towards the 1.20 handle. As I alluded to earlier, that is a major support level on the monthly timeframe, which could open up a move all the way down to the 1.10 level if it does in fact get broken through. As things stand right now, it does not look like it is an imminent threat, but it is something to keep in the back of your mind.

