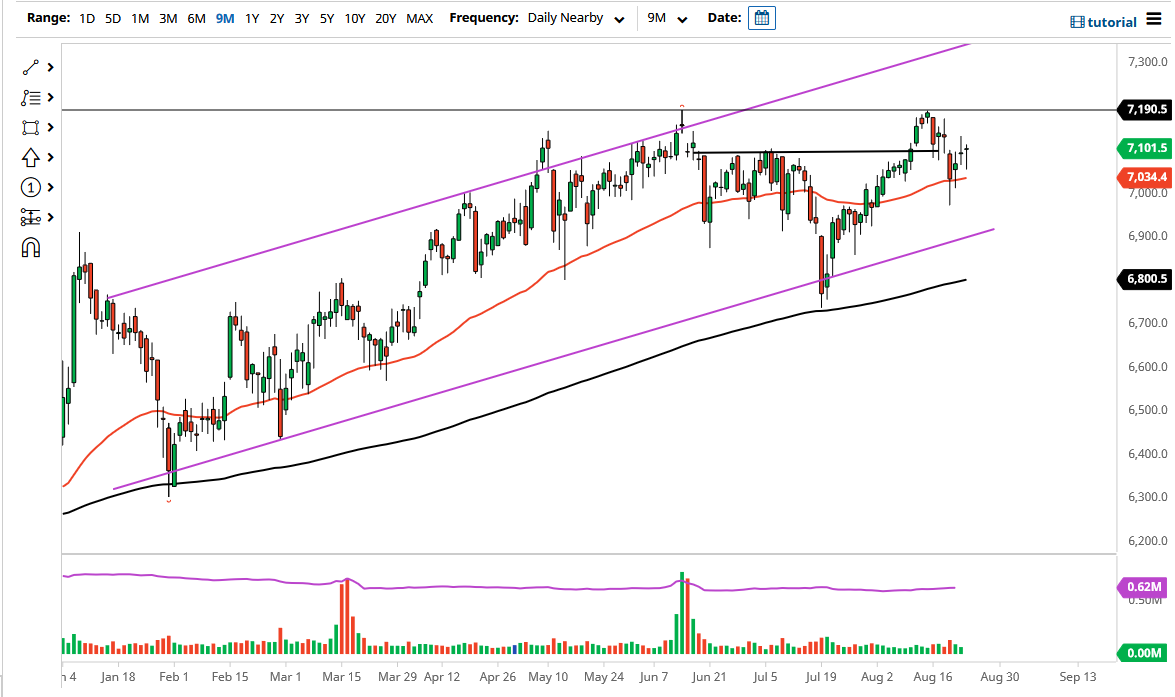
The FTSE 100 initially fell on Tuesday but then turned around to show signs of strength again as the 50-day EMA offered support. The 50-day EMA is very widely followed due to the fact that it is the average of the past quarter. The market has been rising for some time, but it has become much more volatile over the last several months.
The 7100 level has been a bit of a magnet for price, but if we break above the top of the candlestick from the Monday session, then it is likely that we could go looking towards the 7190 handle. Breaking above that then opens up the possibility of taking out the 7200 level and going much higher. At this point, the market is likely to continue seeing buyers on dips, as it looks like the central banks around the world will continue to flood the markets with liquidity, driving stock markets higher.
If we were to break down below the 50-day EMA, then we will probably go looking towards the support line based upon the channel that we have been in for some time. The 200-day EMA sits just below there, which is widely followed by technical traders as well. As long as we stay above the 200-day EMA, we are technically in an uptrend, so it is very possible that we will see plenty of value hunters out there. The British pound has rallied a bit over the last couple of days, but really at this point it is still very cheap based upon historical comparison, meaning that the exports coming out of the United Kingdom continue to be cheap enough for other people to buy, at least that is the theory in general. Nonetheless, I think what we are looking at here is a market that has recently made an attempt to form a “double top”, and if we break above this potential area, then it is likely that we will continue to go much higher over the longer term. Regardless, I do not have any interest in shorting this market anytime soon, so I am looking for a pullback to get long or perhaps even a break out.

