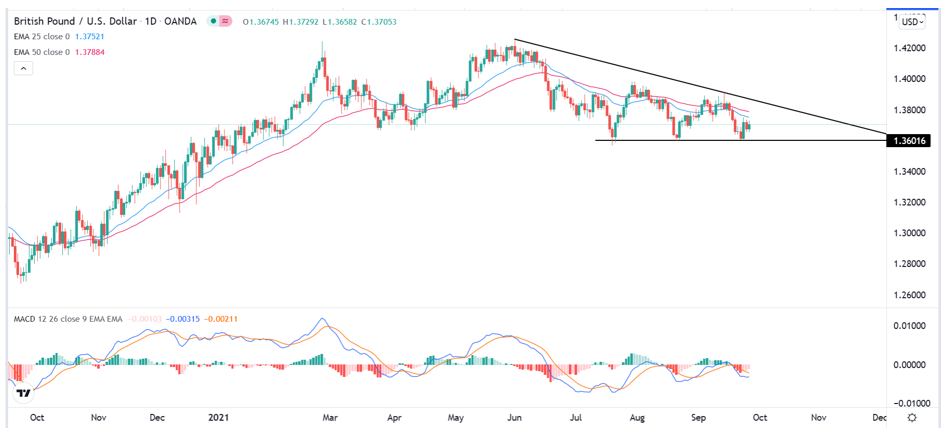
Bearish view
- Set a sell-stop at 1.3600 and a take-profit at 1.3500.
- Add a stop-loss at 1.3700.
- Timeline: 2-3 days.
Bullish view
- Set a buy-stop at 1.3770 and a take-profit at 1.3850.
- Add a stop-loss at 1.3700.
The GBP/USD held steady in the overnight session as fears of higher inflation in the UK rose after crude oil and natural gas prices jumped. The pair is trading at 1.3700, which was above last week’s low of 1.3656.
UK Inflation Set to Rise
In its interest rate decision last week, the Bank of England (BOE) warned that consumer prices will likely rise to more than 4% in the near term. The bank cited the ongoing supply chain disruptions, truck drivers shortages, and rising energy prices.
The sentiment could come true as oil and natural gas prices kept rising. The price of Brent crude oil jumped to a three-year high of more than $78 per barrel while that of natural gas soared to more than $5.5. Therefore, there is a likelihood that consumers will bear the cost of these increases as inflation rises.
The biggest catalyst for the GBP/USD today will be a testimony by Jerome Powell and the latest consumer confidence data in the US. Powell will testify before Congress as the country continues to navigate the risky budget ceiling issue.
With a deadline of September 30th nearing, lawmakers will want to know what the Fed expects to do. A government shutdown could see the Treasury run out of cash needed to pay the country’s debt.
Meanwhile, the Conference Board will publish the latest consumer confidence numbers. Economists polled by Reuters expect the data to show that consumer confidence rose from 113.8 to 114. This is an important number because consumers are the biggest component of the country’s GDP. As such, highly confident consumers tends to buy more, which is a good thing for an economy.
The data will come a day after the US published mixed durable goods order numbers. The headline durable goods orders rose by 1.8% while core orders dropped to 0.3%.
GBP/USD Forecast
The GBP/USD pair has been in a tight range recently. On the daily chart, we see that it has formed a descending triangle pattern that is shown in black. The lower side of this triangle is at 1.3600. The downward trend is also being supported by the 25-day and 50-day moving averages while the MACD is slightly below the neutral level.
Therefore, the pair will likely breakout lower because a descending triangle is a sign of bearish continuation.

