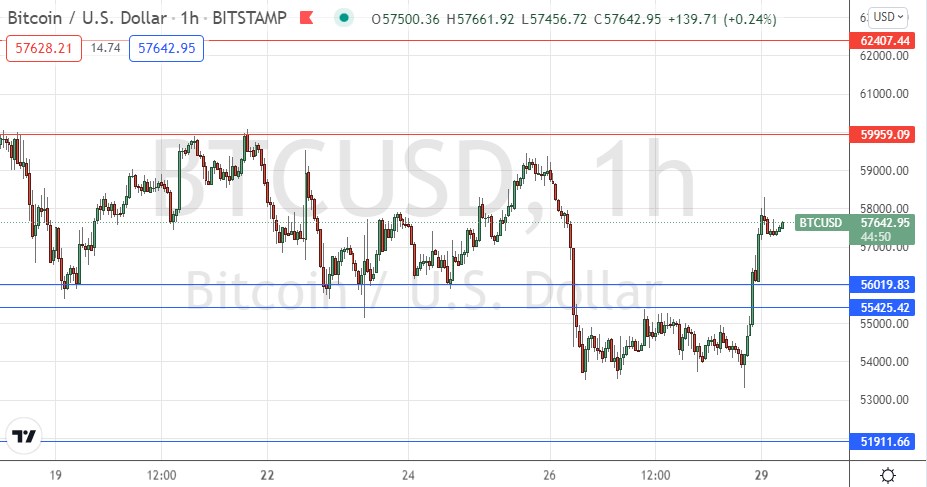
Last Monday’s BTC/USD signal were not triggered as there was no bullish price action when the support level at $56,537 was first reached that day.
Today’s BTC/USD Signals
Risk 0.50% per trade.
Trades must be taken before 5pm Tokyo time Tuesday.
Long Trade Ideas
Long entry after a bullish price action reversal on the H1 time frame following the next touch of $56,020, $55,425, or $51,912.
Put the stop loss $100 below the local swing low.
Move the stop loss to break even once the trade is $100 in profit by price.
Remove 50% of the position as profit when the trade is $100 in profit by price and leave the remainder of the position to ride.
Short Trade Ideas
Short entry after a bearish price action reversal on the H1 time frame following the next touch of $59,959 or $62,407.
Put the stop loss $100 above the local swing high.
Move the stop loss to break even once the trade is $100 in profit by price.
Remove 50% of the position as profit when the trade is $100 in profit by price and leave the remainder of the position to ride.
The best method to identify a classic “price action reversal” is for an hourly candle to close, such as a pin bar, a doji, an outside or even just an engulfing candle with a higher close. You can exploit these levels or zones by watching the price action that occurs at the given levels.
BTC/USD Analysis
I wrote last Monday the technical picture had become more bearish, so I was looking for a break below the support level I had identified at $56,537 and the round number at $55k, to signal a new short trade aiming for the price to fall at least as far as the $50k area.
This was not a bad call insofar as I was correct to see the $55k area as the ultimate pivotal point for signalling directional bias, and the price rose after getting very close to $55k that day.
The price continued to consolidate below $60k over most of last week, looking neither bullish nor bearish over the medium term, although there is a bearish drift over time. Then the omicron variant panic on Friday pushed the price down to new lows below $55k, but the price has rebounded strongly over the past day on new hopes that the omicron variant will not have a catastrophic economic impact.
Although the price chart below shows the price is back within a wide zone without key support or resistance levels between $56k and $60k, there may be hidden resistance and support close by – the price is much more congested than it looks.
I think we will see choppy trading in Bitcoin today until we get some more decisive news about the omicron variant.
It is still possible to take a long from a bullish bounce at $56,020 or a bearish rejection of $60k if either of these scenarios set up today, but it would be wise to be conservative on taking profit from either trade.
There is nothing of high importance scheduled for today regarding the USD.

