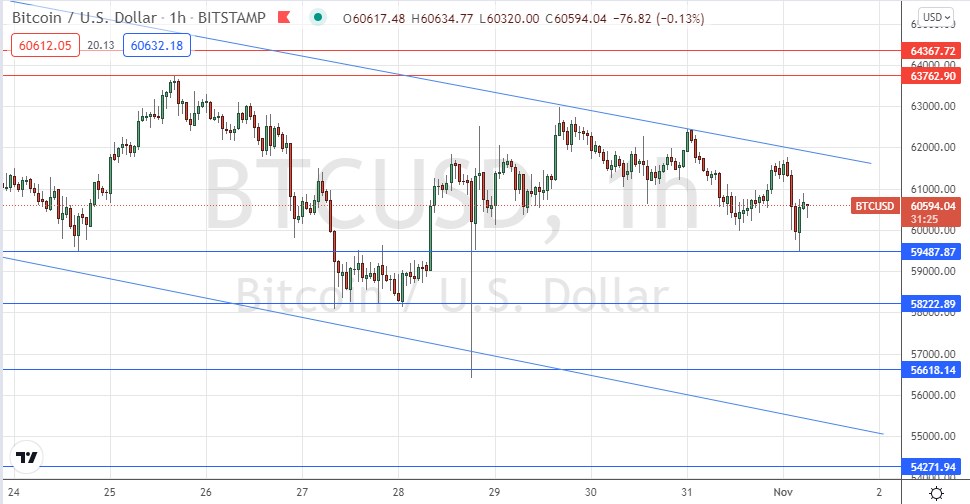
Last Wednesday’s BTC/USD signal produced a profitable long trade from the slow bullish bounce which rejected the support level I had identified at $58,906.
Today’s BTC/USD Signals
Risk 0.50% per trade.
Trades must be taken before 5pm Tokyo time Tuesday.
Long Trade Ideas
Go long after a bullish price action reversal on the H1 time frame following the next touch of $59,488, $58,223, $58,906 or $58,541.
Put the stop loss $100 below the local swing low.
Adjust the stop loss to break even once the trade is $100 in profit by price.
Remove 50% of the position as profit when the trade is $100 in profit by price and leave the remainder of the position to ride.
Short Trade Ideas
Go short after a bearish price action reversal on the H1 time frame following the next touch of $63,763 or $64,368.
Put the stop loss $100 above the local swing high.
Adjust the stop loss to break even once the trade is $100 in profit by price.
Remove 50% of the position as profit when the trade is $100 in profit by price and leave the remainder of the position to ride.
The best method to identify a classic “price action reversal” is for an hourly candle to close, such as a pin bar, a doji, an outside or even just an engulfing candle with a higher close. You can exploit these levels or zones by watching the price action that occurs at the given levels.
BTC/USD Analysis
I wrote last Wednesday that the price was being compressed into a narrowing triangle, with a supportive floor just below $60k with a key level at $58,906.
As the price was bouncing at $58,906, I saw Bitcoin at a pivotal moment which could provide a good opportunity to buy or sell, perhaps for the long term.
This was a good call as the price rose from that support, giving an attractive and profitable long trade opportunity, although the sudden spike down to lower lows would have made this a losing trade if held for too long without adjusting the stop loss.
The technical picture in Bitcoin has changed as it becomes obvious that despite firm buying continuing at support levels, the price is slowly moving downwards within a wide symmetrical price channel. When such channels are symmetrical, they usually hold, at least for a while. So, there is a strong force depressing the price of Bitcoin right now.
I am prepared to buy Bitcoin from a bullish bounce at the lowest key support level within the descending price channel at $56,618.
I will not be confident Bitcoin is ready to really take off again until the price not only decisively breaks out of the descending price channel but also clears the resistance levels at $63,763 and $64,368.
Regarding the USD, there will be a release of ISM Manufacturing PMI data at 2pm London time.

