Bearish View
- Set a sell-stop at 42,500 and a take-profit at 40,000.
- Add a take-profit at 44,000.
- Timeline: 1-2 days.
Bullish View
- Set a buy-stop at 43,500 and a take-profit at 45,000.
- Add a stop-loss at 42,000.
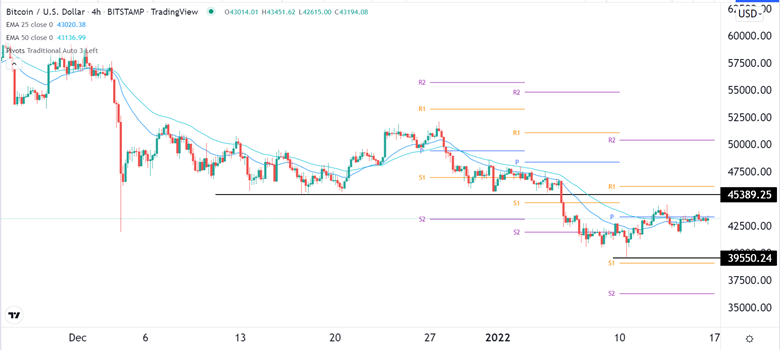
The BTC/USD pair moved sideways during the weekend as investors attempted to buy the dip following last week’s major crash. The pair is trading at 43270, which is about 9.50% above the lowest level last week. The pair is still about 17% below its highest level in December last year.
Bitcoin Attempts Rebound
Bitcoin, the biggest cryptocurrency in the world, has been under intense pressure in the past few weeks. This performance started in November when the coin jumped to its all-time high of over $68,000.
It has coincided with the first actions by the Federal Reserve to start tightening. In November, the Fed decided to start tapering its asset purchase program. Its officials also started about the need to embrace a more hawkish tone in a bid to slow inflation down.
These concerns have continued this year. For one, minutes published this month showed that officials were considering implementing about three rate hikes this year. Some officials have also said that more rates than that are necessary in a bid to lower consumer prices.
The BTC/USD pair made some modest gains last week after the US published the latest consumer inflation data. The data revealed that the headline consumer inflation data rose to 7% as most analysts were expecting.
While this was the highest number in four decades, the numbers showed that inflation was starting to peak. This was confirmed when the producer price index (PPI) declined slightly in December.
Bitcoin and other risky assets tend to underperform in a period of high-interest rates. This explain why the Nasdaq 100 index has lagged the S&P 500 and Dow Jones indices this year.
The BTC/USD is also holding steady ahead of the closely-watched North American Bitcoin Conference in Miami. Key speakers will be Mark Cuban and the founders of Tether and Ripple.
BTC/USD Forecast
The four-hour chart shows that the BTC/USD pair declined to a low of 39,550 last week, which was its lowest level in two months. The pair has bounced back and is now trading at about 43,270. It is now along the 50-day and 25-day moving averages. It is also between the key channel at 39,550 and 45,390. It is also along the standard pivot point.
Therefore, at this point, the outlook for the pair is neutral with a bearish bias considering that the bullish comeback has found a resistance. As such, a retest of about 40,000 cannot be ruled out.

