Bearish View
- Sell the BTC/USD pair and set a take-profit at 36,000.
- Add a stop-loss at 40,000.
- Timeline: 1-2 days.
Bullish View
- Set a buy-stop at 39,250 and a take-profit 41,000.
- Add a stop-loss at 37,000.
The BTC/USD pair remained in a tight range as investors reacted to critical statements by Warren Buffett and Charlie Munger. Bitcoin is trading at $38,490, where it has been in the past few days. This price is about 20% below the highest level in April.
Bitcoin Still in Consolidation
The BTC/USD pair has been in a strong consolidation phase as investors reflect on the relatively strong US dollar. The dollar index has jumped to the highest level in years as investors focused on the upcoming interest rate decision.
Economists expect that the Fed will hike interest rates by 0.50% and then start implementing its quantitative tightening (QT) policy. In most cases, risky assets like Bitcoin and stocks tend to underperform in a period of high interest rates.
Bitcoin’s price action has also mirrored the performance of American shares. On Monday, the Dow Jones declined by more than 200 points while the Nasdaq 100 index fell by 50 points. At the same time, the CBOE VIX index rose by more than 4%, signaling that investors are getting fearful. Further, the Bitcoin fear and greed index has moved to the extreme fear zone of 26.
The BTC/USD pair is also consolidating after receiving criticism about Bitcoin from Warren Buffett and Charlie Munger. When holding their meeting in Omaha, the Berkshire Hathaway leaders argued that Bitcoin was a non-yielding asset. At some point, Buffett announced that he would not buy all Bitcoins in the world for $25.
His statement is closely watched because of his influence in the market since he is one of the most successful investor of all time. Bitcoin also declined after Wikimedia announced that it will stop accepting Bitcoin and Ethereum donations.
BTC/USD Forecast
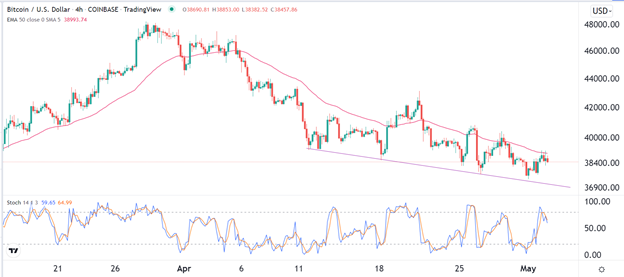
The BTC/USD pair has been in a tight range in the past few days. The pair is trading slightly below the resistance level at 39,000. It has moved slightly below the 50-day exponential moving averages (EMA) while the Stochastic Oscillator has moved below the oversold level. Other oscillators like the Relative Strength Index (RSI) has also tilted lower.
Notably, the pair has formed a head and shoulders pattern, signaling that it will likely have a bearish breakout. The pair will likely keep falling as bears target the neckline of the neckline at about 37,200.

