Previous BTC/USD Signal
My previous signal on 31st August was not triggered as none of the key levels were reached that day.
Today’s BTC/USD Signals
Risk 0.50% per trade.
Trades must be taken prior to 5pm Tokyo time Friday.
Long Trade Ideas
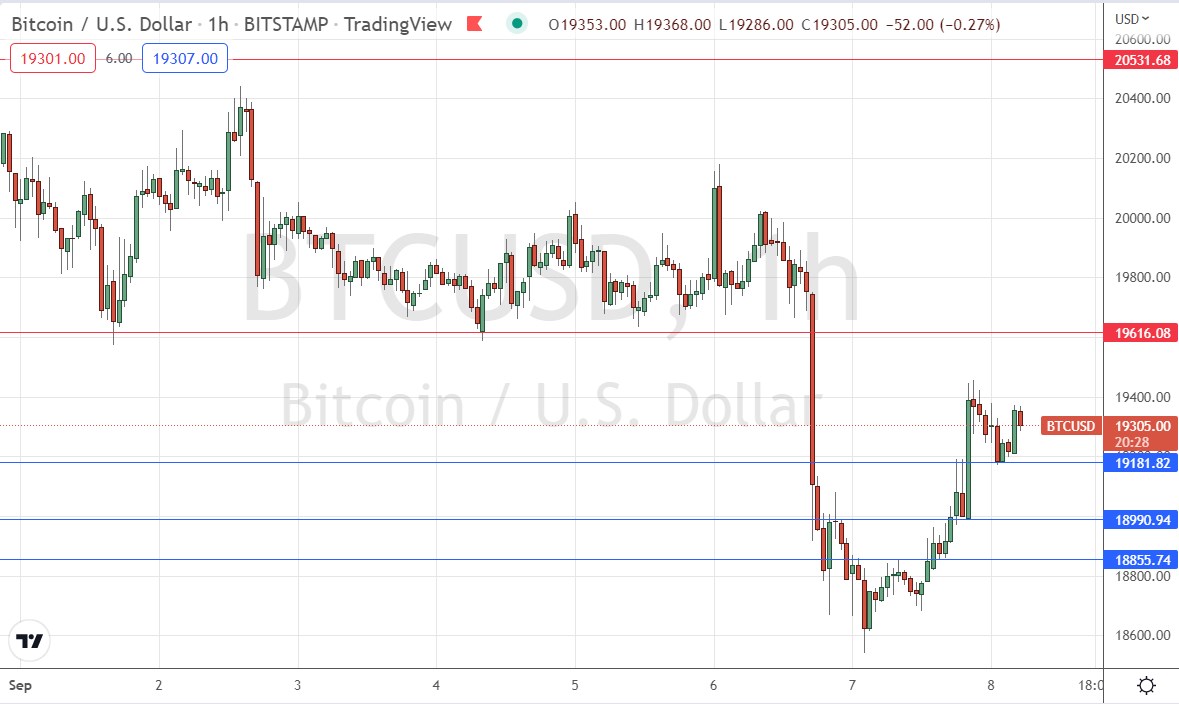
- Long entry after a bullish price action reversal on the H1 timeframe following the next touch of $19,182, $18,991, or $18,856
- Put the stop loss $100 below the local swing low.
- Move the stop loss to break even once the trade is $100 in profit by price.
- Remove 50% of the position as profit when the trade is $100 in profit by price and leave the remainder of the position to ride.
Short Trade Ideas
- Short entry after a bearish price action reversal on the H1 timeframe following the next touch of $19,616 or $20,532.
- Put the stop loss $100 above the local swing high.
- Move the stop loss to break even once the trade is $100 in profit by price.
- Remove 50% of the position as profit when the trade is $100 in profit by price and leave the remainder of the position to ride.
The best method to identify a classic “price action reversal” is for an hourly candle to close, such as a pin bar, a doji, an outside or even just an engulfing candle with a higher close. You can exploit these levels or zones by watching the price action that occurs at the given levels.
BTC/USD Analysis
I wrote in my previous analysis on 31st August that the price of BTC/USD seemed to be topping out near the resistance level at $20,532 to produce a double top. I saw a well-defined consolidation range between $20,532 and $19,616 which could be played by trading reversals at either extreme level.
This was a good call. I also said that the key thing to watch in Bitcoin is whether the price would get established below the lowest key support level at $19,163. We finally saw a breakdown below this level, which remains very pivotal, and may now act as key resistance, or as a benchmark which could indicate that the bearish breakdown is over.
Yesterday saw Bitcoin continue to fall, in line with the strong US Dollar which was pushing other assets back everywhere. Bitcoin barely made a new long-term low, but then bounced back with a strong U-shaped bullish reversal, as can be seen in the price chart below. Adding to the strength of this bullish move are the new support levels close below which the buying action has printed.
The price now looks quite likely to continue to rise and eventually test the pivotal point at $19,163. What happens here will be crucial to watch. There is technically room for Bitcoin to now fall quickly to an area below $15k, but while this looked possible yesterday, the price action is not showing any signs this will happen today.
Longer-term traders can look for a potential short trade from a failure to break above $19,163 once that level is reached. Conversely, if the price breaks above that and we get a couple of consecutive higher hourly closes showing bullish momentum, the price will be likely to rise higher.

Ther is nothing of high importance scheduled today concerning the US Dollar.
Ready to trade our daily Bitcoin signals? Here’s a list of some of the best crypto brokers to check out.
