The difference between success and failure in Forex / CFD trading is highly likely to depend mostly upon which assets you choose to trade each week and in which direction, and not on the exact methods you might use to determine trade entries and exits.
So, when starting the week, it is a good idea to look at the big picture of what is developing in the market as a whole, and how such developments and affected by macro fundamentals, technical factors, and market sentiment. Read on to get my weekly analysis below.
Fundamental Analysis & Market Sentiment
I wrote in my previous piece on 11th September that the best trades for the week were likely to be:
- Short of the EUR/USD currency pair, but only from reversals at key resistance. There was a bearish reversal at $1.0195 which could have given about 130 pips profit by the weekly close.
- Long of the USD/JPY currency pair, but only from reversals at key support. None of my key support levels were reached during last week.
This produced an overall win.
The news is dominated by last week’s worse than expected US CPI (inflation) data, which produced a strengthening of risk-off sentiment and saw a flow into the US Dollar. The data suggested that inflationary pressures remain stronger and wider than had been widely expected, which is seen to increase the likelihood that the Fed will hike rates this week by a full 1.00%, with a best-case scenario of 0.75% effectively a given. Goldman Sachs has lowered its US GDP growth forecast for the US in 2023 from 1.5% to 1.1%. The US 2-Year Treasury Yield rose strongly from the 3.50% area to a new multi-year above 3.90%, while the US Dollar Index also made a long-term weekly high closing price. Stock markets fell strongly, with the key S&P 500 Index ending the week 5.15% lower while almost all other major global indices also fell, notably the Chinese HSI which is very close to breaking down to new long-term lows.
Regarding market movements, the most dramatic beyond the stock market was seen in the commodities sector, with almost every commodity ending the week lower. Gold was a notable standout as it closed well below $1700 at a near 2.5-year low. In the Forex market, despite the strong US Dollar, the Japanese Yen refused to fall any further, likely due to the signals sent by the Bank of Japan and other Japanese policymakers that the Yen slide has gone far enough for their liking. The major Forex movements over the week were in flows from the commodity currencies (the Canadian, Australian, and New Zealand Dollars) into the US Dollar, although the GBP/USD currency pair also broke down to reach a new 37-year low price below $1.14.
The details of the important economic data releases last week can be summarised as follows:
- US CPI – rose by 0.1% month on month when a decline of 0.1% had been expected.
- UK CPI – came in very slightly lower than expected, at an annualized rate of 9.9% when 10.0% was expected.
- UK GDP – came in lower than expected, with a 0.2% month on month increase when 0.3% was expected.
- US PPI – a month on month decline of 0.1%, exactly as expected.
- US Retail Sales – this increased month on month by 0.3% while a decline of 0.1% was expected.
- New Zealand GDP – grew by 1.7% over the quarter, higher than the 1.0% which had been expected.
- Australian Unemployment – came in slightly worse than had been expected, with the unemployment rate rising slightly from 3.4% to 3.5%.
- US Empire State Manufacturing Index
- US Preliminary UoM Consumer Sentiment data
The Forex market saw relative strength in the US Dollar last week. The weakest currencies were the NZD, AUD, CAD, and GBP.
Rates of coronavirus infection globally dropped last week for the ninth consecutive week. The only significant growths in new confirmed coronavirus cases overall right now are happening in Russia and Taiwan.
The Week Ahead: 19th September – 23rd September 2022
The coming week in the markets is likely to see a considerably higher level of volatility than last week, with several major central bank releases due, including the most important event in the Forex calendar, the US Federal Reserve’s monetary policy decision. Releases due are, in order of likely importance:
- FOMC Federal Funds Rate, Statement, and Economic Projections.
- Bank of Japan Monetary Policy Statement and Policy Rate
- Bank of England Official Bank Rate and Monetary Policy Summary
- SNB Policy Rate and Monetary Policy Assessment
- RBA Monetary Policy Meeting Minutes
- Canadian CPI (inflation) data
- US Fed Chair Powell will deliver a minor speech
- Manufacturing & Services PMI data for USA, UK, Germany, and France
- Governor of the RBNZ will deliver a minor speech
It is a public holiday this Monday 19th September in Japan and the UK, and on Friday 23rd September in Japan.
Technical Analysis
U.S. Dollar Index
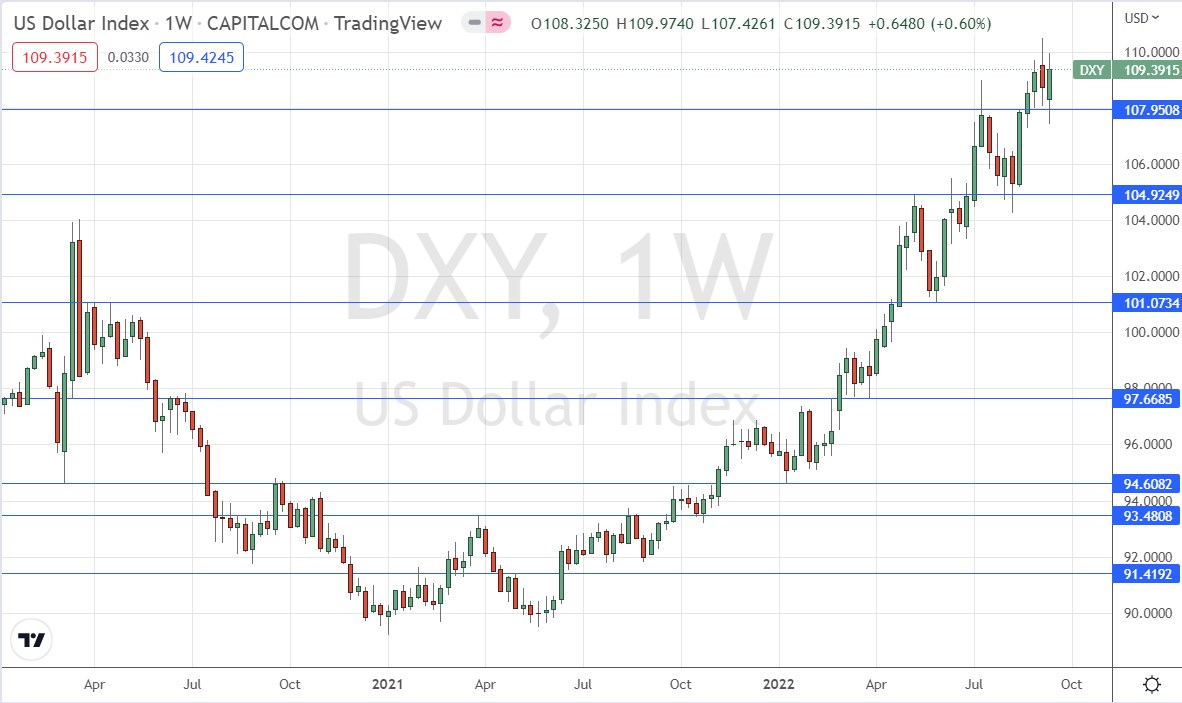
The weekly price chart below shows the U.S. Dollar Index printed a bullish candlestick which closed up, in line with the long-term trend, which is bullish.
The weekly closing price was the highest seen in many years, which is a bullish sign. However, it should be noted that this is barely higher than the close of two weeks ago, and that last week’s high did not exceed the high of the previous week. These are signs that bulls may need to be cautious.
The reason for the muted bullishness is mainly that the Dollar’s two largest counterparties, the Japanese Yen, and the Euro, are holding up relatively well, although the Dollar is advancing strongly against other currencies. Nevertheless, the Dollar got a major boost from the higher-than-expected US CPI data released last week.
We seem to have a new support level formed at last week’s low near or at 108.00, which adds to the bullish case.
It remains a good idea to look for long trades in the US Dollar over the coming week. This is a very powerful, long-term bullish trend in the most important currency in the Forex market.
XAU/USD (Gold)
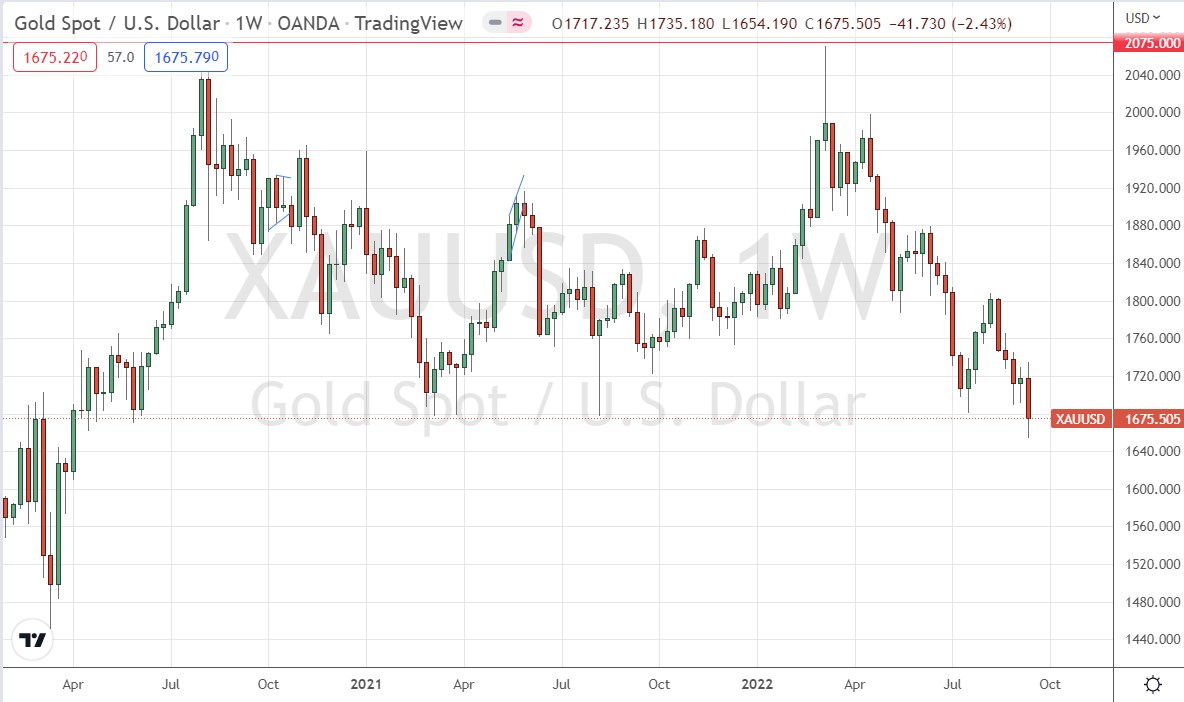
Last week saw Gold print a bearish outside bar which saw the precious metal reach its lowest price since the coronavirus panic of April 2020. The candlestick does have a meaningful lower wick, so bears need to be at least a little cautious here.
I do not like trading Gold short, because historically it does not trend downwards in a smooth and predictable way. However, Gold is strongly positively correlated with the US stock market, and we see stocks and other commodities all moving down as risk-off sentiment sends strong money flows into the US Dollar. There is no haven from inflation in the market right now, and the solution for investors seems to be speculating that the US Dollar will continue to strengthen, despite its high rate of inflation.
NASDAQ 100
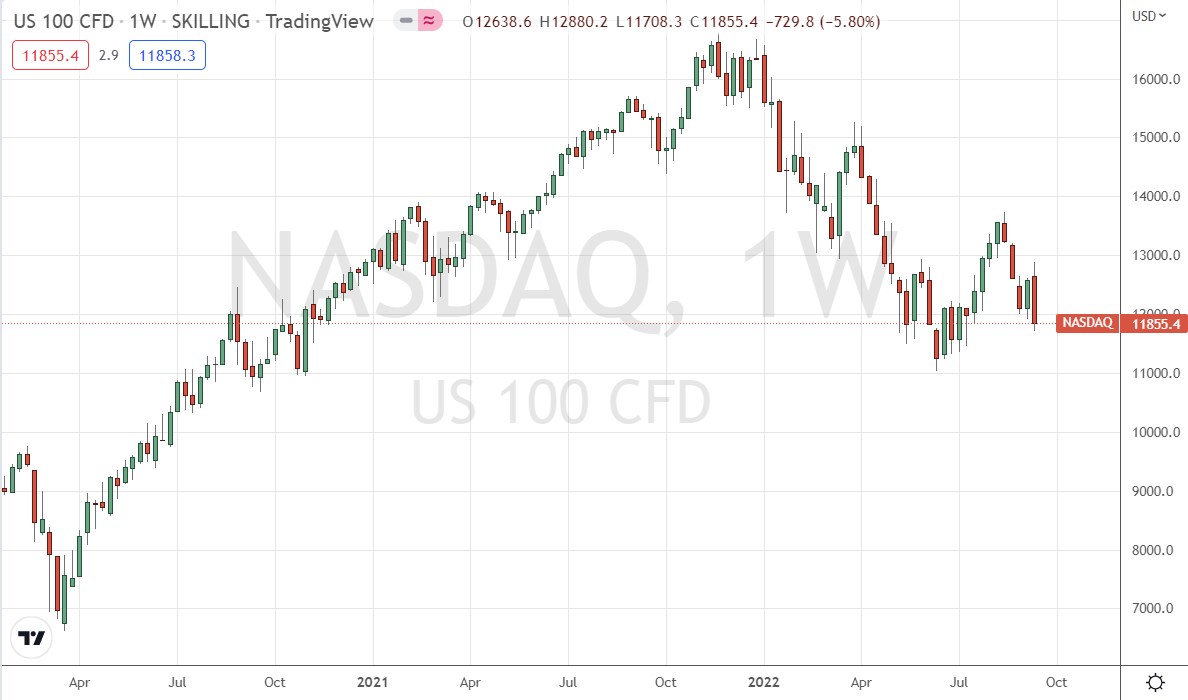
The NASDAQ 100 tech index fell sharply last week, printing a bearish outside bar, as almost all major global stock indices fell. Global stocks have taken a serious beating due to the persistently high inflation data we are seeing in the US leading to an increased expectation that the Fed will hike rates by a full 1% this week, which would make life harder for major companies and consumers.
I do not like to trade stocks short, as they are prone to sudden and strong bullish reversals, but there may be continuing opportunities here on the short side if we continue to see strong bearish momentum as markets open on Monday.
GBP/USD
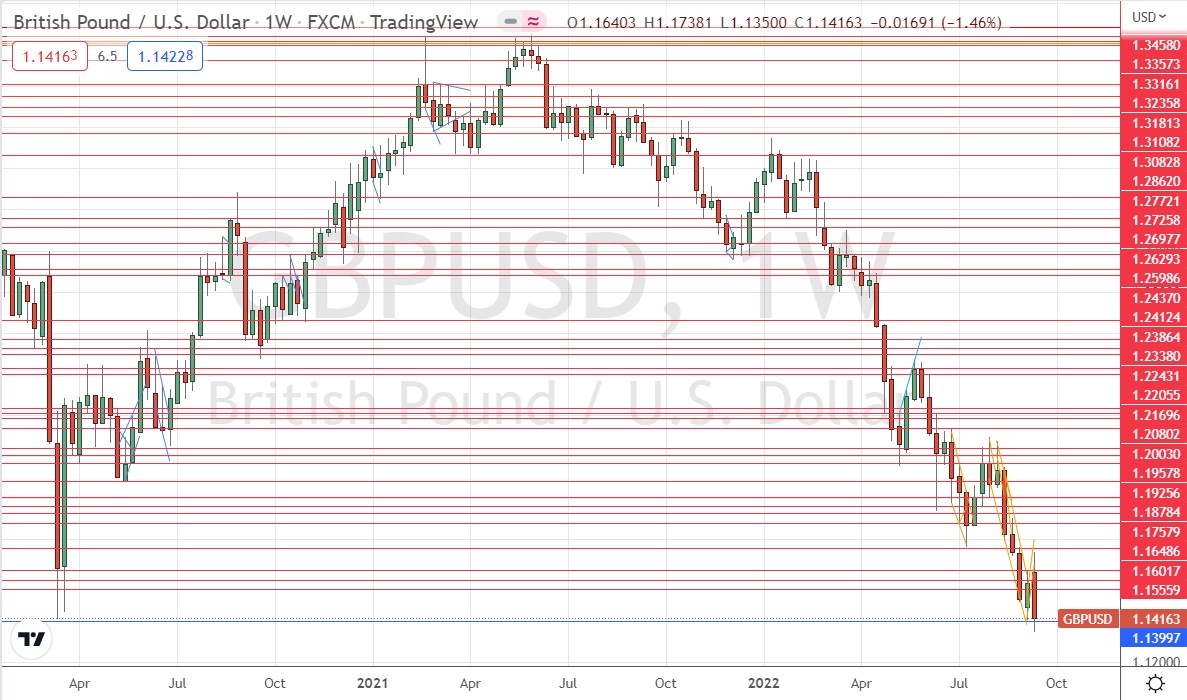
Last week saw the GBP/USD currency pair print a bearish outside bar which saw the currency pair reach its lowest price since 1985, a 37-year record low.
This is a very bearish sign, but bears should note that not only does the candlestick have a meaningful lower wick, the low rejected the key support level and round number confluence at $1.1400.
The US Dollar is strong but is failing to advance against the Euro and the Japanese Yen. The British Pound is beset by extremely high inflation at almost 10% and a weakening economy, with the Bank of England predicting a 5-quarter recession starting at the end of this year. Therefore, there are good fundamental reasons to seeing a good case for a short trade.
I would not take any short trades until the price is below the low of last week at $1.1350, as it would then be trading in “blue sky” which has not been reached for decades and would have no technical limitation working against a further strong decline.
NZD/USD
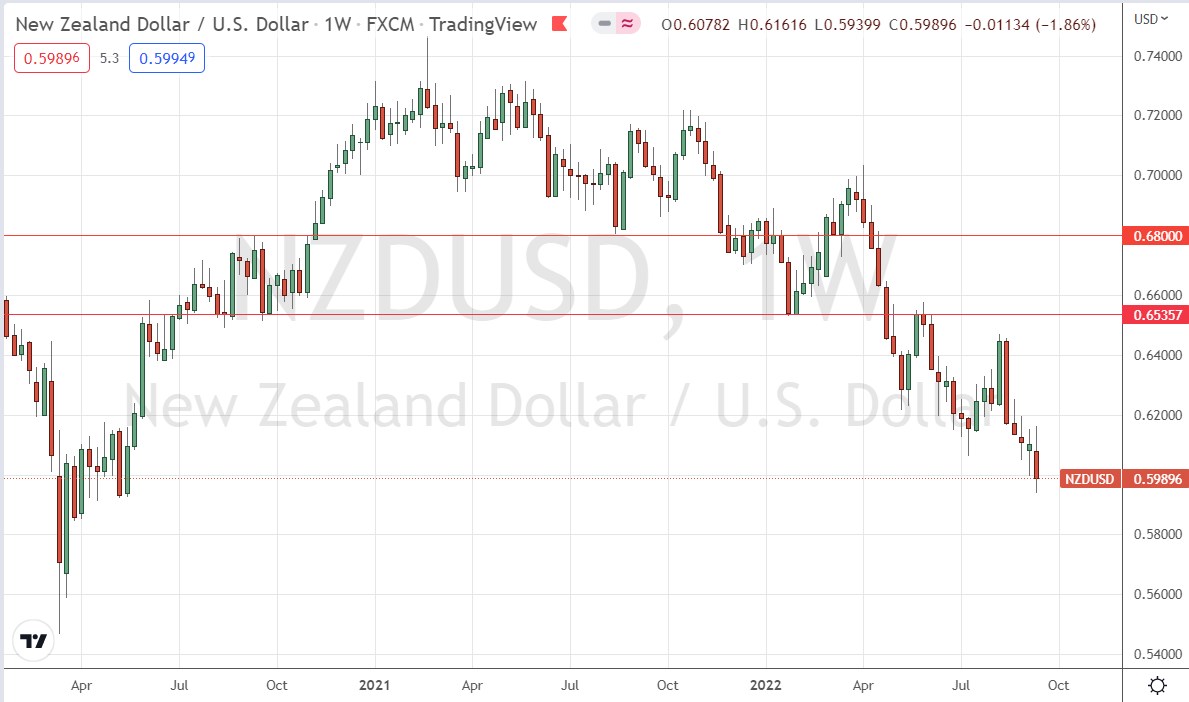
Last week saw the NZD/USD currency pair print a bearish outside bar which saw the currency pair reach its lowest price since the coronavirus panic of May 2020. The candlestick does have a meaningful lower wick, so bears need to be at least a little cautious here.
Last week saw the US Dollar strengthen notably against the British Pound and the three commodity currencies, the latter including the NZD, and the NZD fell more firmly than did the Australian or Canadian Dollars. Therefore, I think that trading this currency pair short is probably a terrific way to exploit the current risk-off sentiment which is prevalent in the market. However, it is important to wait and see how this coming week opens and what happens during Monday’s Asian session when this pair is typically quite active.
It is interesting to note that the relatively high interest rate in the NZD is not saving it from declining to fresh long-term lows.
I would not take any short trades until the price is below the low of last week at 0.5940.
Bottom Line
I see the best opportunity in the financial markets this week as likely to be short of the GBP/USD currency pair below $1.1350.
Ready to trade our weekly Forex forecast? Here are the best Forex brokers to choose from.
