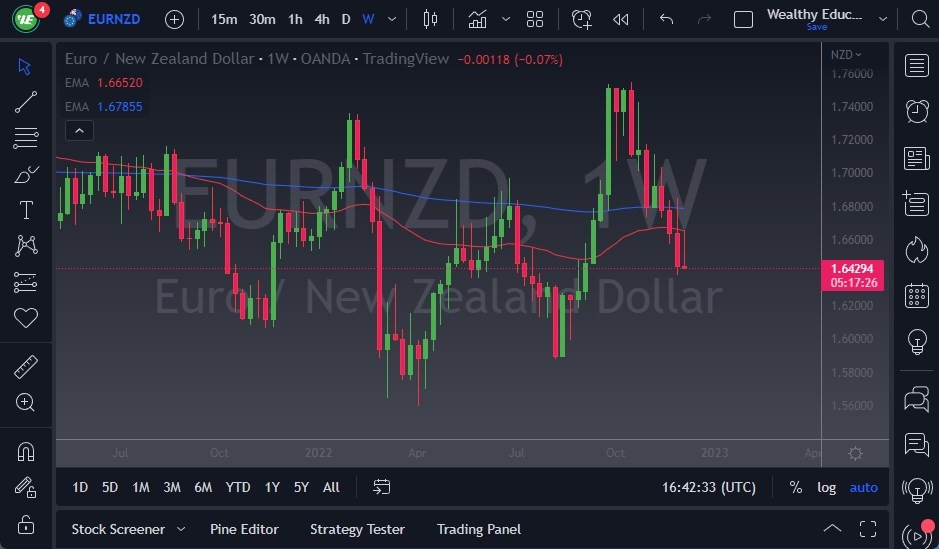
USD/JPY
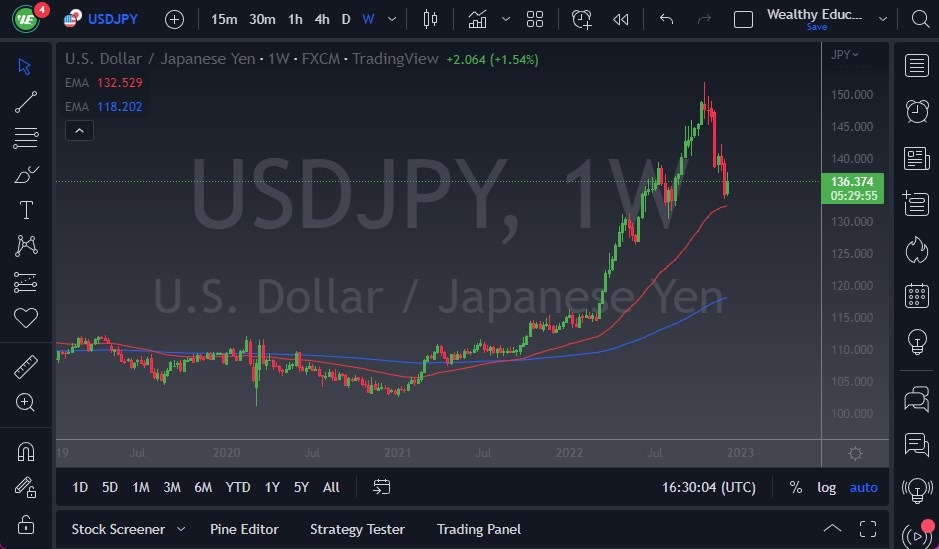
The USD/JPY recovered a bit during the previous week, after dropping quite drastically. Because of this, it does make a certain amount of sense that we will have to pay close attention to this next week, and the Federal Reserve meeting. After all, this pair is highly sensitive to the interest rate markets, as the Bank of Japan continues to do whatever it can to keep interest rates down. It will break down below the 50-Week EMA, which could be the death knell for the trend.
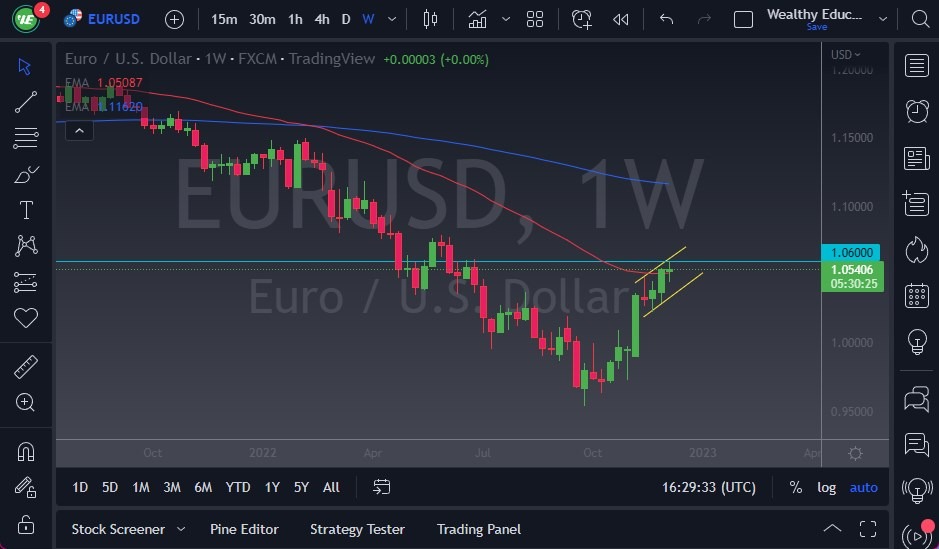
EUR/USD
The EUR/USD has had a very noisy week, as we continue to struggle with the idea of breaking out above the 1.06 level. This is not a huge surprise, because we have the Federal Reserve meeting on Wednesday, followed by the European Central Bank meeting on Thursday. Because of this, it’s likely that the next week will be very choppy and back and forth, at least until we get through all of that. I would best describe this market as “neutral” at the moment.
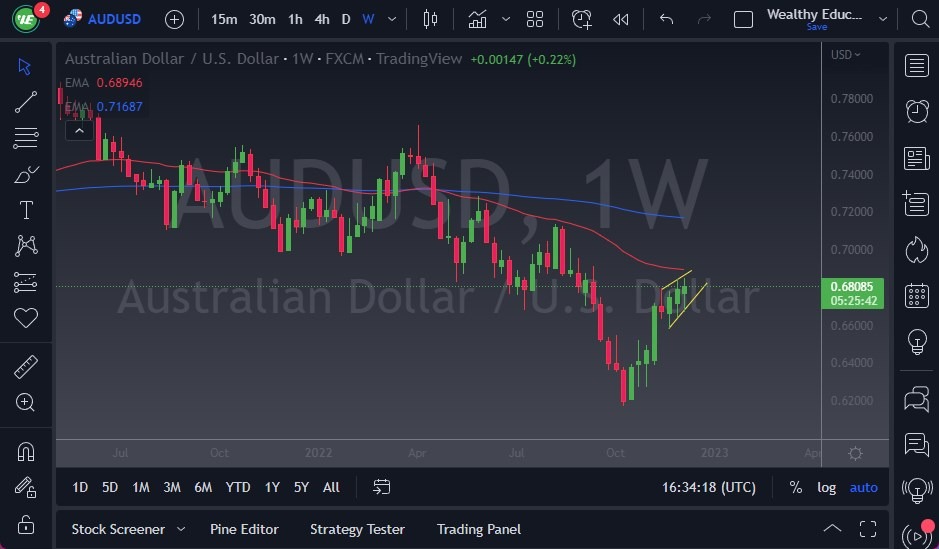
AUD/USD
The AUD/USD has been grinding higher for some time, and this past week was no different. But that’s the key word here: “grind.” In fact, you can make an argument that we are forming a rising land, as we approach the 50-Week EMA. This is a very interesting place to see that, because the 0.68 level has caused a lot of noise for some time.
If we break down below the bottom of this uptrend line, that could open up the possibility of a move to the 0.66 level, and then possibly down to the 0.65 level. On the other hand, if we take out the 50-Week EMA above, then the Aussie almost certainly will go looking to the 0.70 level.
GBP/JPY
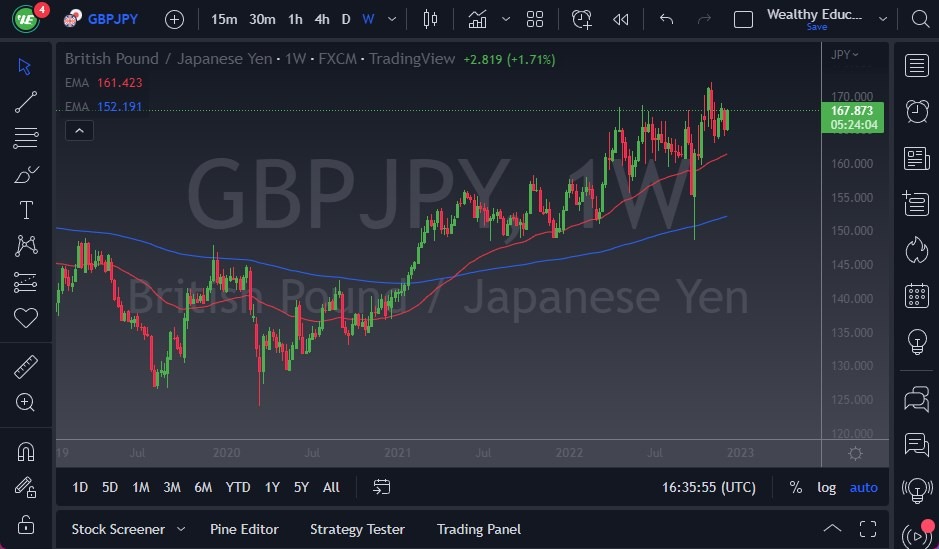
The GBP/JPY has had a positive week, as we continue to grind higher. At this point, the pattern is very clear in this pair, you are looking for dips that you can buy on shorter time frames. As far as longer-term trades are concerned, the only thing that the weekly chart can tell you is that the buyers are relentless. The ¥167.50 level is going to take a lot of effort to get above, but if we do break above there, then the ¥170 level be the next target.
USD/CHF
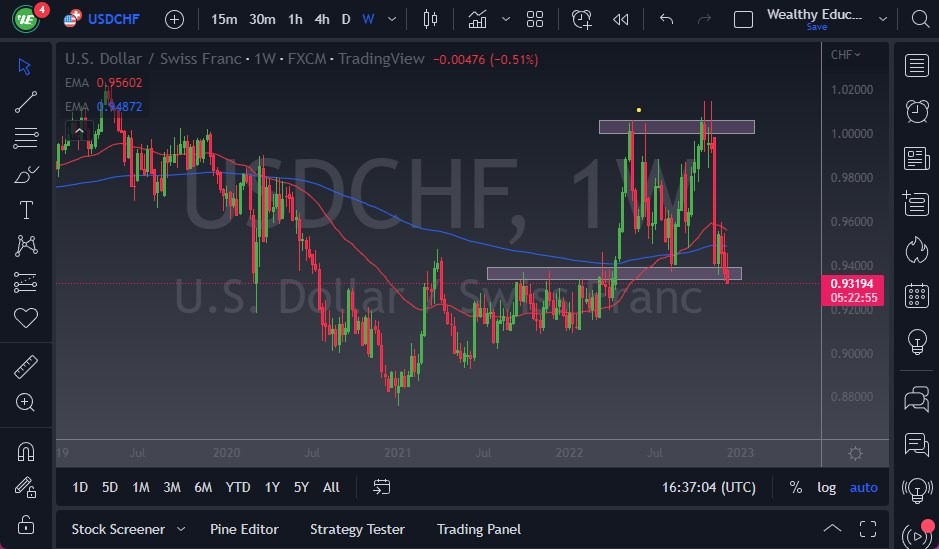
The USD/CHF had initially tried to rally during the previous week but has really started to fall apart. That being said, we are heading into a very noisy area that extends down to the 0.91 CHF level, so I think you have to be cautious about getting overly aggressive to the downside. That being said, this is probably going to be highly influenced by the overall directionality of the US dollar, so pay attention to other markets to give you a little bit of a “heads-up” as to how this one plays out.
CAD/JPY
The CAD/JPY initially tried to recover during the week but gave back quite a bit of the gain to show signs of hesitation. This is a market that has been oversold for quite some time, so having said that it’s a look that suggests that we are going to continue to see negativity. After all, that nasty candlestick from the previous week was barely challenged. I suspect that if we break down below the ¥100 level, we will continue to see downward pressure. Pay attention to the Japanese yen overall because it will certainly tear up the Canadian dollar if it has strength in other places as oil drops.

NZD/USD
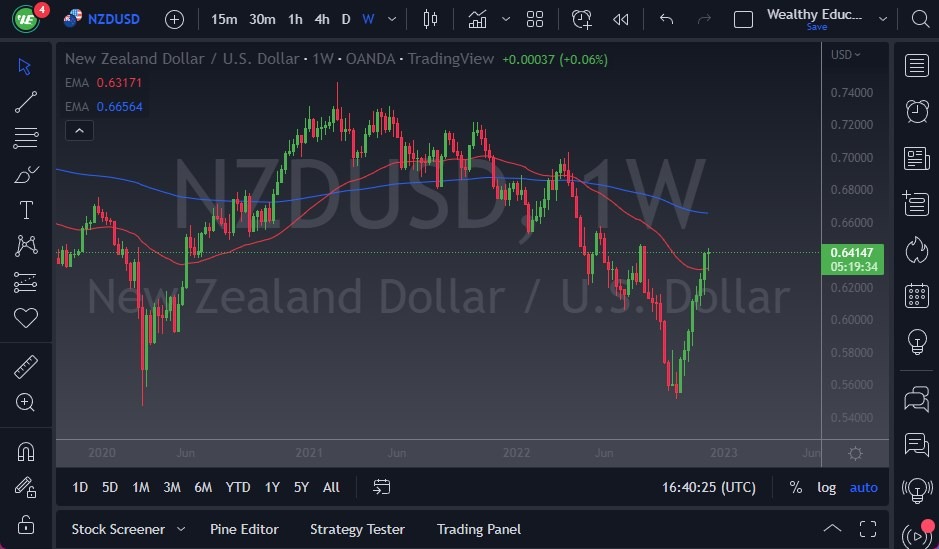
The NZD/USD is threatening the 0.65 level, as we are closing out the week just above the 0.64 level. The ship that candlestick is a bit of a hammer, so I think at this point it looks like we are trying to build up enough pressure to finally slice through the 0.65 level, and if we do that would be a massive turnaround for the New Zealand dollar. That being said, it’s likely that the 50-Week EMA underneath could come into the picture. If we were to break down below the bottom of the candle, that would be a “handyman”, which of course is a very negative sign, and could send this market much lower. It is worth suggesting that we are a little overextended.
EUR/NZD
The EUR/NZD initially tried to rally but fell toward the 50-Week EMA. It suggests to me that perhaps this is a market that is going to continue to see a lot of noisy volatility, it may see a bit of negativity going forward as well due to the fact that we ended up forming a massive, inverted hammer. If the market were to turn around a break above the top of that inverted hammer, then we could see a run toward the 1.70 level. On the other hand, if we break down the weekly candlestick from the previous week, then we could start to fall apart again.
