The difference between success and failure in Forex / CFD trading is highly likely to depend mostly upon which assets you choose to trade each week and in which direction, and not on the exact methods you might use to determine trade entries and exits.
So, when starting the week, it is a good idea to look at the big picture of what is developing in the market as a whole, and how such developments and affected by macro fundamentals, technical factors, and market sentiment. There are some valid long-term trends in the market right now, which might be exploited profitably. Read on to get my weekly analysis below.
Fundamental Analysis & Market Sentiment
I wrote in my previous piece on 22nd January that the best trade opportunities for the week were likely to be long of Gold in USD terms and the EUR/USD currency pair. Gold in USD terms gained by 0.09% and the EUR/USD currency pair ended the week higher by 0.10%. These trades gave a small average win of 0.10%.
The news is currently dominated by a more risk-on tilt seen in the markets as inflation expectations lower, especially in the USA, with greater optimism emerging that the Fed can begin to halt rate hikes without having caused a recession. Stock markets and the Australian Dollar have unsurprisingly been the biggest gainers of the week in this environment. US Core PCE Price data came in as expected so there was no disturbance to this lower inflation outlook, and US Advance GDP data came in a bit higher than expected at a 2.9% rather than 2.6% increase, consolidating the positive mood.
The Bank of Canada hiked its interest rate by 0.25% to a relatively high 4.50%, but markets saw it as a slightly “dovish” hike as the Bank made it clear it thought its tightening policy had worked by slowing down the economy, hinting that hikes are almost done. This had the effect of weakening the Loonie a little.
The other major news of the week was Australian inflation coming in higher than expected, increasing at an annualized rate of 8.4%, well above the 7.6% which had been expected. This increases the likelihood of stronger rate hikes and had the effect of firmly boosting the Aussie over the week.
Global stock markets ended the week mostly higher, with the Hang Seng Index standing out as reaching its highest point in 11 months. Several commodities are also rising. The Forex market saw the greatest strength in the Australian Dollar last week, with the Japanese Yen again the weakest major currency.
Rates of coronavirus infection worldwide again dropped last week for the sixth consecutive week according to official data, with the lowest overall numbers seen since July 2020. However, there are credible reports suggesting millions of new infections after China’s “zero covid” measures were recently scrapped.
The Week Ahead: 30th January – 3rd February 2023
The coming week in the markets is likely to see a much higher level of volatility compared to the past week, as there are several major data releases scheduled including the FOMC’s Federal Funds Rate and Statement. The scheduled major releases, in order of importance, are:
- US FOMC Statement and Federal Funds Rate – a hike of 0.25% to 4.75% is expected.
- US Non-Farm Payrolls
- ECB Main Refinancing Rate and Monetary Policy Statement
- Bank of England Official Bank Rate and Monetary Policy Summary
- Canadian GDP data
- US CB Consumer Confidence data
- US JOLTS Job Openings
- US ISM Services PMI
- New Zealand Unemployment data
- US ISM Manufacturing PMI data
Technical Analysis
U.S. Dollar Index
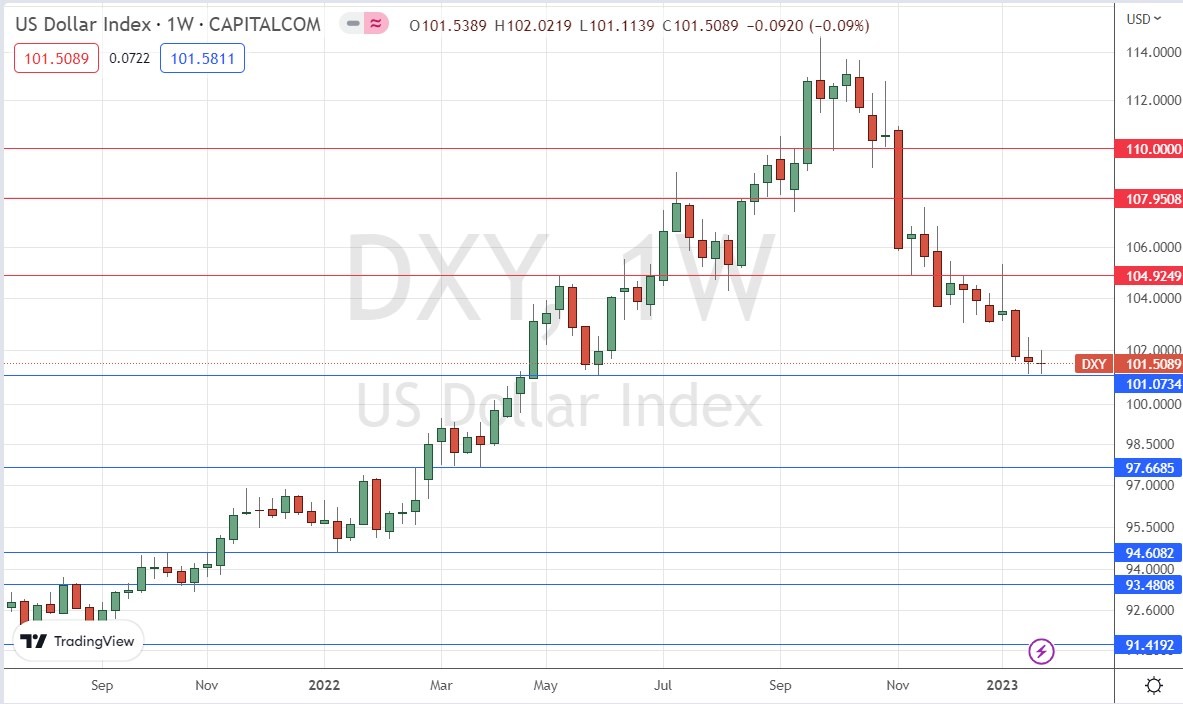
The weekly price chart below shows the U.S. Dollar Index printed a second consecutive small doji candlestick, which typically signifies directional indecision. Notably, it was also an inside candlestick, which is even more indicative of indecision and a possible directional reversal. The low of the week rejected the support level shown at 101.07 for the second consecutive week, which is a negative sign for bears.
We see the Dollar within a long-term bearish trend, with the price continuing to trade well below its levels of both 3 and 6 months ago.
I do not like to trade against long-term trends, so I will still look to only be in trades which are short of the greenback this week. However, there are increasing signs that the bearish trend is now going to pause or make a deeper bullish retracement, so traders should be cautious and watch out for this.
XAU/USD (Gold)
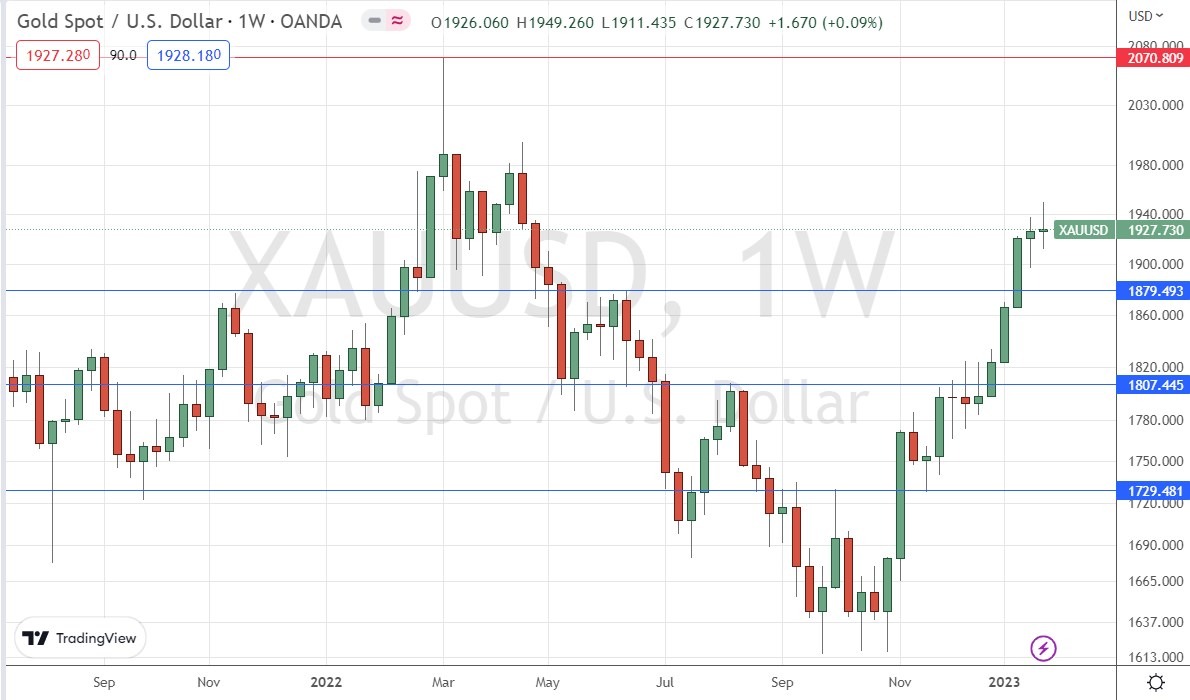
Last week Gold again printed a bullish doji candlestick which made the highest weekly close seen since April this year. The price also reached a new long-term high which is a bullish sign. However, the bullish momentum is fading, as evidenced by the fact that the weekly close was not above the previous week’s high price.
There are no overhead resistance levels nearby, so the price can probably advance quite easily to the big round number at $2,000, although there are some signs that the $1,950 handle is providing some resistance.
Despite the two consecutive doji candlesticks, the technical picture still looks bullish, although weakly so.
The price of Gold remains somewhat likely to continue to rise this week.
EUR/USD
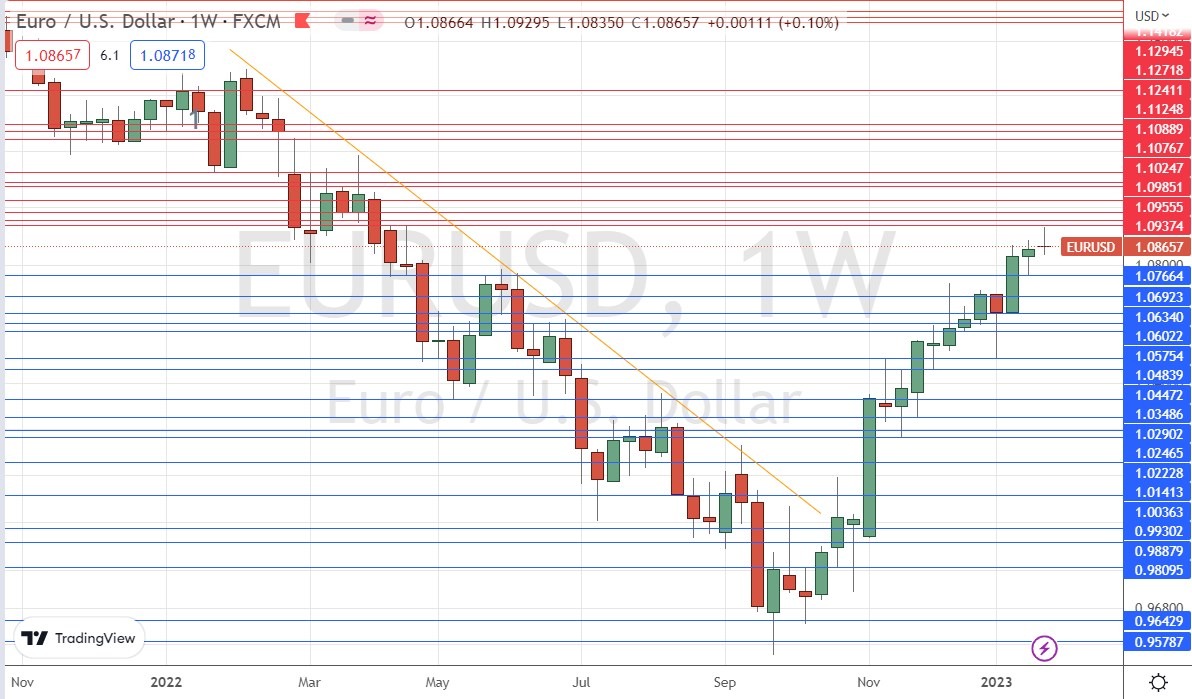
Last week saw the EUR/USD currency pair print a doji candlestick which made the highest weekly close in ten months. The price also reached a new long-term high - these are bullish signs, but the bullish momentum is certainly slowing.
It is also significant, and possibly a bearish sign, that the price was held down by the nearby resistance level at $1.0937.
Despite the consecutive doji candlesticks, which can signify indecision in the market, the technical picture still looks weakly bullish.
The price of this currency pair is likely to continue to rise this week, in line with its long-term trend. Long-term trends are statistically notably reliable in this currency pair.
AUD/USD
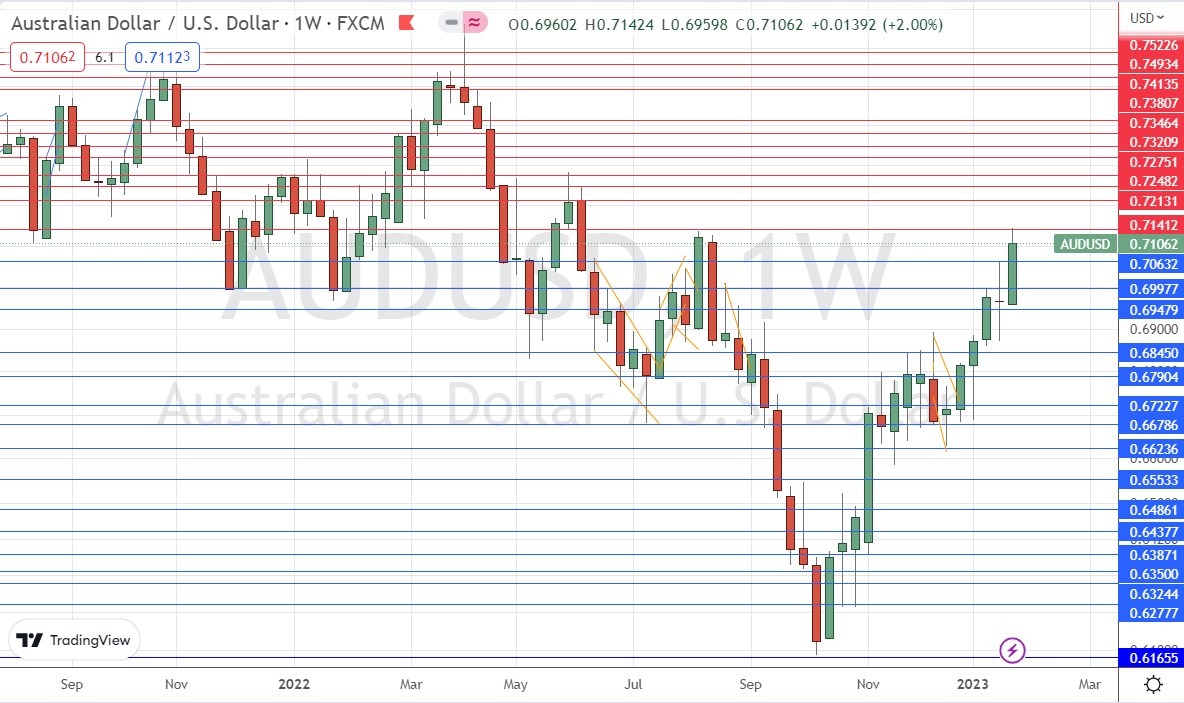
Last week saw the AUD/USD currency pair print a sizable bullish candlestick which made the highest weekly close in more than 5 months. The price closed not far the top of the week’s wide range, which is another bullish sign, suggesting healthy momentum in the Australian Dollar.
The advance by the Aussie was boosted by higher-than-expected Australian inflation data released last week, which is making the market think that the Reserve Bank of Australia will be very likely to make further rate hikes soon.
The price of this currency pair is somewhat likely to continue to rise this week, in line with its long-term trend. However, bulls should watch out for the yearly high at $0.7141, which is likely to continue to act as strong resistance, at least when next touched.
S&P 500 Index
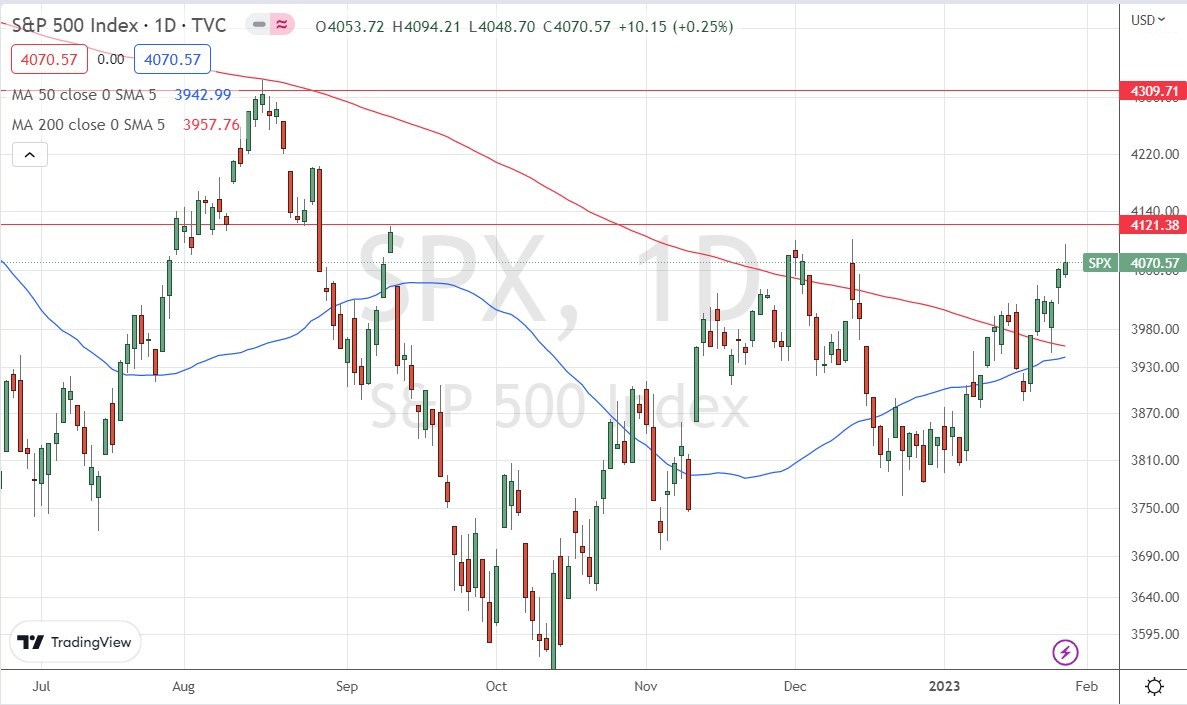
Last week saw the S&P 500 Index rise just as almost every other major stock index rose.
The daily price chart below includes the 50-day and 200-day simple moving averages. It can be seen that a bull cross (or golden cross) is very likely to happen over the coming days, where the 50-day MA will cross over the 200-day MA. Such a cross historically indicates the beginning of a major bull move, so it could be a good long-term buy signal.
Despite this more bullish outlook, many technical analysts will only be comfortable being fully bullish on this index once the price has gotten established above the obvious resistance level shown below at 4121.
Much is likely to depend this week on what the FOMC does and says next Wednesday.
Other major stock market indices are looking even more bullish than the S&P 500 Index, including the NASDAQ 100 Index.
BTC/USD
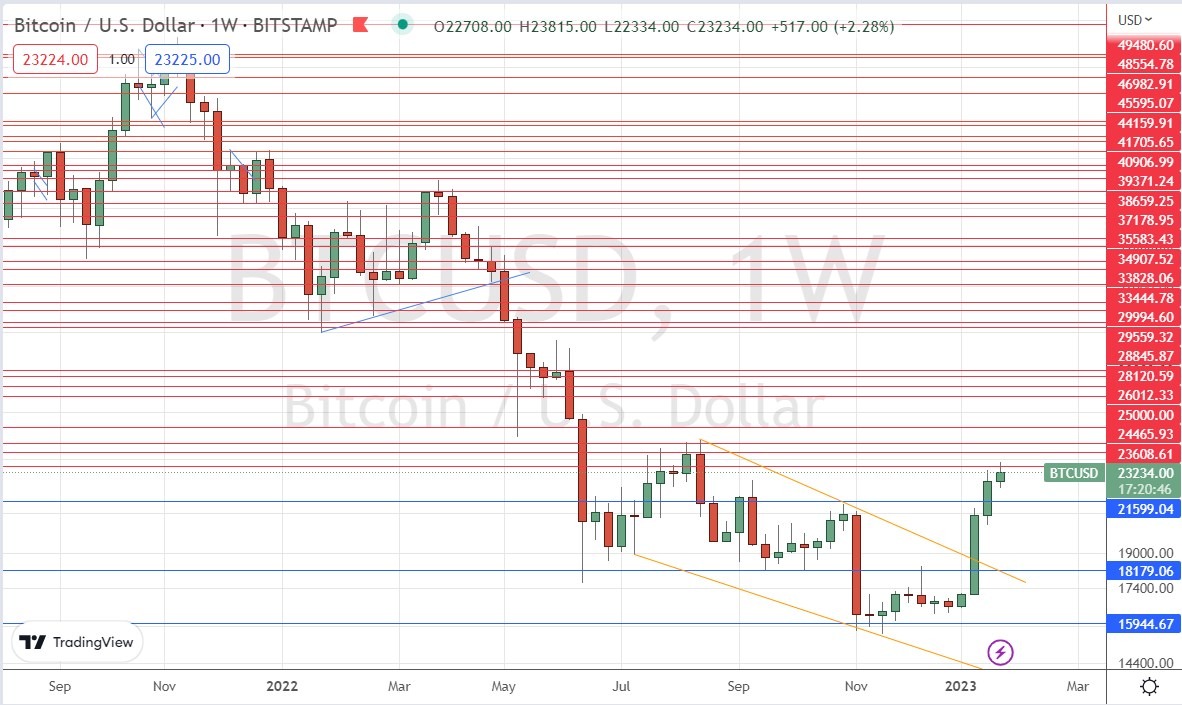
The last week has seen the price of Bitcoin rise again. The price has reached its highest level since August after many weeks consolidating above $16k.
Although the direction and trend are both clearly bullish, which has tended to be statistically quite dependable in Bitcoin, the bullish momentum has clearly slowed down a lot, and the price has been held by the resistance level at $23,609.
The main thing bulls need to watch out for is whether the bulls can launch a sustained breakout above $23,609. However, even if they can, there are two further resistance levels between there and the huge round number at $25,000– so I am not optimistic that the price of Bitcoin will be able to rise much higher over the coming week.
Bottom Line
I see the best opportunity in the financial markets this week as likely to be long of Gold in USD terms and the EUR/USD currency pair. If the S&P 500 Index makes a bull cross (golden cross), it may be a great entry signal for a long-term investment.
Ready to trade our weekly Forex forecast? Here are the best Forex brokers to choose from.

