The difference between success and failure in Forex / CFD trading is highly likely to depend mostly upon which assets you choose to trade each week and in which direction, and not on the exact methods you might use to determine trade entries and exits.
So, when starting the week, it is a good idea to look at the big picture of what is developing in the market as a whole, and how such developments and affected by macro fundamentals, technical factors, and market sentiment. There are a few valid long-term trends in the market right now, which might be exploited profitably. Read on to get my weekly analysis below.
Fundamental Analysis & Market Sentiment
I wrote in my previous piece on 21st May that the best trade opportunities for the week were likely to be:
- Long of the NASDAQ 100 Index. The Index ended the week 3.90% higher.
- Long of the USD/JPY currency pair. This currency pair ended the week higher by 1.90%.
- Buying GBP/USD following a bullish bounce at a key support level. The price bounced at $1.2309 on Thursday and ended the week about 20 pips higher than the entry, giving a profit of about 0.15%.
My forecast produced an overall win of 5.95%, averaging a gain of 1.98%.
Markets remain dominated by two ongoing debates in the USA – whether the Federal Reserve has really completed its cycle of rate hikes, and how the impasse over the debt ceiling will be resolved (nobody really expects the USA to default). As opinion on these issues swing back and forth, the Dollar and stock markets swing up and down, with analysts scrutinizing every piece of US data for clues as to what the Fed will likely do at its next policy meeting in June.
The past week has seen material changes concerning both issues. The Treasury Secretary Janet Yellen has made it clear that the US will not default before 5th June, buying some time. It has become increasingly likely that the two political sides are close to reaching a deal to resolve the issue, and anyway, nobody truly expects a default. When a deal eventually is announced, it will still probably produce a risk-on surge in the financial markets.
The second issue is the question of whether the Fed will hike rates by another 25bps at its next meeting in June. It looks increasingly likely that they will, as evidenced by last week’s firm rise in the 2-Year US Treasury Yield, plus higher than expected US Core PCE Price Index data (a month-on-month increase of 0.4% when only 0.3% was expected) which suggests inflation may be running higher. This has prompted a strong advance by the US Dollar, which gained against almost every other currency last week. The broad US stock market has been weakly bullish despite the prospect of another rate hike, but the stocks which are really taking off are technology stocks. The NASDAQ 100 Index has risen by more than 7.59% in the last two weeks alone and is up by more than 30% since the start of 2023.
Another key issue in the Forex market last week was the Reserve Bank’s of New Zealand surprise signal that it is done raising rates as the Bank believes it has done enough to control inflation. The Bank also hiked its Official Cash Rate by 0.25% to 5.50%, which is the highest rate of any major currency. However, the fact that this now seems quite certain to be the terminal rate caused the Kiwi to fall sharply, and the bearish momentum there continues.
Markets will now be focused on the US debt ceiling impasse and US non-farm payrolls data due at the end of the week.
Last week’s other key data releases were:
- US FOMC Meeting Minutes – this revealed that members were split on the last rate hike, but this had little effect on the market.
- US Preliminary GDP data – this showed the US economy growing faster than expected, at an annualized rate of 1.3% last quarter, when only 1.1% was expected.
- British CPI (inflation) data – this showed a smaller than expected drop in the annualized rate from 10.1% to 8.7%, when 8.2% was expected.
- Flash Manufacturing & Services PMI data in the USA, Germany, UK, and France. This was mostly a little worse than had been expected concerning manufacturing, but services were better in the USA and the EU.
The Week Ahead: 30th May – 2nd June
The coming week in the markets is likely to see a lower level of volatility thank last week, as there are fewer scheduled high-impact releases this week than there were last week. This week’s key data releases are, in order of importance:
- US Non-Farm Employment Change, Average Hourly Earnings, and Unemployment Rate
- German Preliminary CPI (inflation)
- US JOLTS Job Openings
- US CB Consumer Confidence
- Australian CPI (inflation)
- Canadian GDP
- US ISM Manufacturing PMI
- US Unemployment Claims
Monday will be a public holiday in the USA, Germany, the UK, France, and Switzerland.
Technical Analysis
US Dollar Index
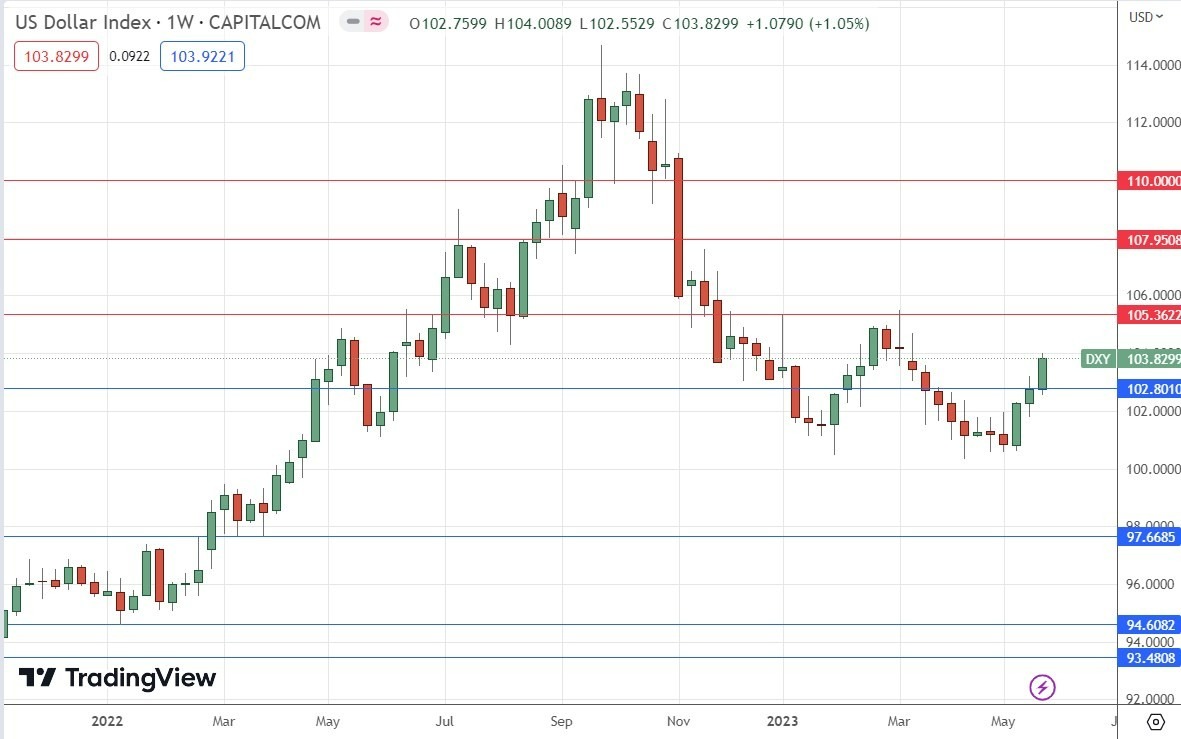
The weekly price chart below shows the U.S. Dollar Index made a strong gain last week against its long-term bearish trend, making a bullish breakout beyond the key resistance level which I had identified at 102.80.
The weekly candlestick is a bullish candlestick with not much upper wick.
Despite these bullish signs, it is true that the greenback remains within a technically valid long-term bearish trend, with its price a little lower than it was both 3 and 6 months ago.
I remain nervous to trade against the US Dollar over the coming week especially as it breaks to new long-term highs against several currencies such as the Japanese Yen, the New Zealand Dollar, and the Euro.

NASDAQ 100 Index
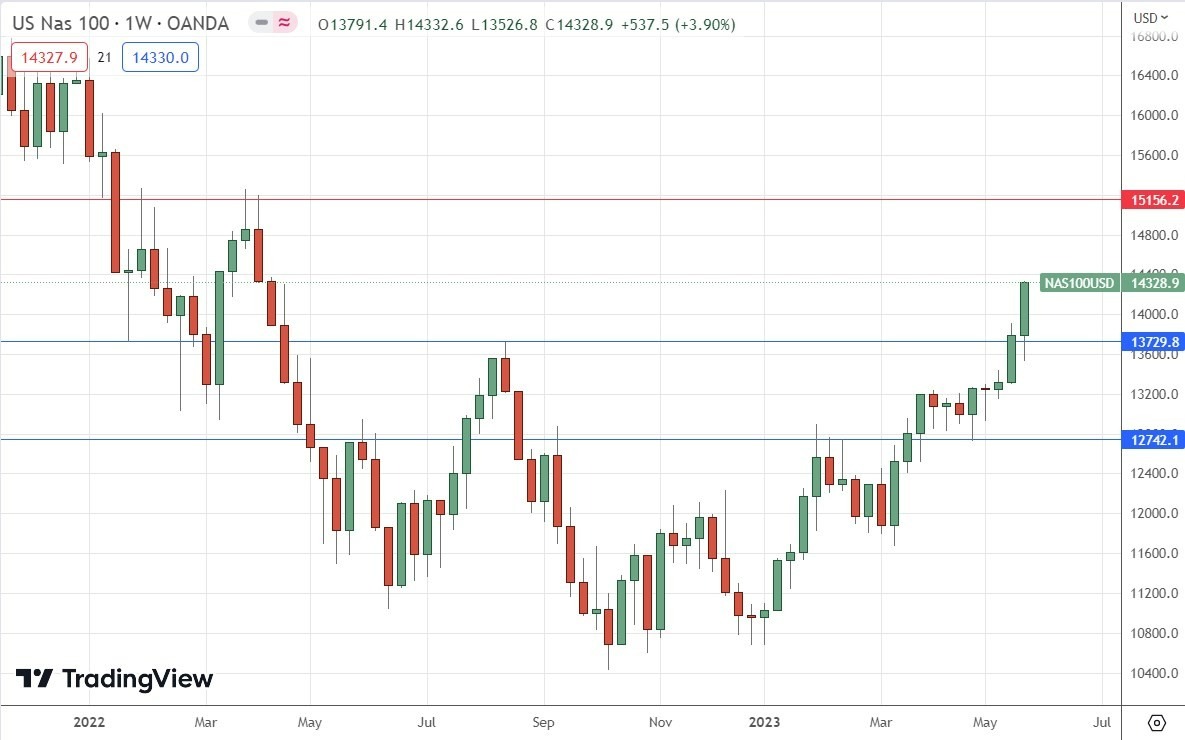
We saw the strongest rise in the NASDAQ 100 Index over the past week in over two months. The picture here is very bullish, for several reasons:
- The weekly candle closed strongly higher, at its highest closing price seen in over one year, for the second consecutive week.
- The weekly candlestick closed right on its high, showing practically no upper wick.
- Stock markets are generally bullish, and the S&P 500 Index is also technically bullish, but less so.
There are no key resistance levels until the 15000 area, so the price has lots of room to rise.
The NASDAQ 100 Index still looks like a buy, but if it quickly retreats below 13730, bulls should be concerned.

USD/JPY
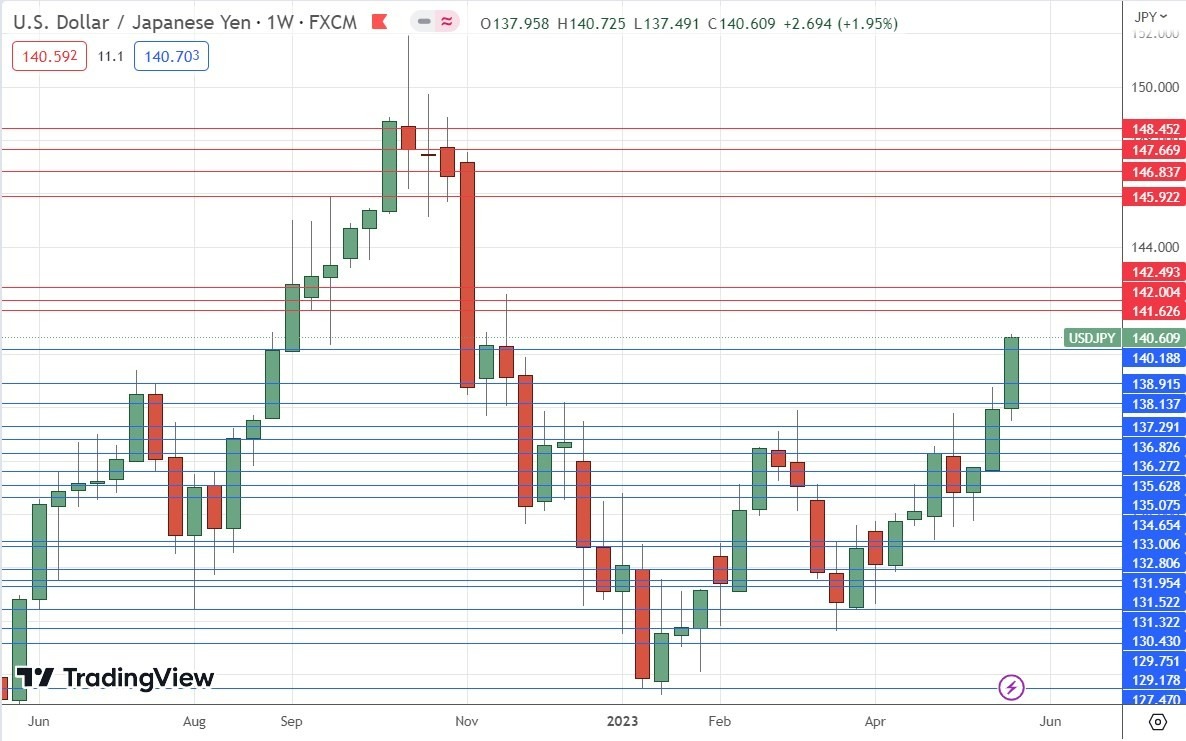
The USD/JPY currency pair rose strongly last week, printing a bullish candlestick which closed near the high of its range, which was above average size.
We now see a valid long-term bullish trend, and last week’s close was the highest weekly close seen in the last 6 months.
Another bullish factor is that the price seems to have gotten established above the big round number at ¥140. We have also seen the price beat some resistance levels that looked likely to be strong not far below this area.
We see long-term weakness in the Japanese Yen, so as the Dollar continues to rise, this currency pair remains in focus.
As a trend trader in major currency pairs, I am long of this currency pair and want to remain long unless we see a big drop. It is worth noting that volatility in the Yen is very high, so longer-term traders will need wide stop losses.

NZD/USD
The NZD/USD currency pair printed a strongly bearish engulfing candlestick, which closed at a 6-month low right near the low of its price range, on above-average volatility. These are all strong signs that we have a real bearish breakdown, and there are good fundamental reasons for this. The only hope for bulls is the likely support level shown in the price chart below at the very big round number of $0.6000.
The US Dollar is weak on the stronger expectation of higher rates over the near term, but the New Zealand Dollar has weakened quite dramatically after the Reserve Bank of New Zealand signaled that it considers inflation beaten by its monetary policy so sees no need to hike rates any further, making the current rate of 5.50% the terminal rate for this tightening cycle. This triggered a strong selloff in the Kiwi.
The big question here is how much further does the price have to fall – for how long with this strong bearish momentum last? It is impossible to tell although $0.6000 could be an obstacle, so it might be best to treat this like a breakdown trend trade and just to go short on new lows with a trailing stop loss. More cautious traders might wish to wait for a daily close below $0.6000.

Bottom Line
I see the best trading opportunities this week as:
- Long of the NASDAQ 100 Index.
- Long of the USD/JPY currency pair.
- Short of the NZD/USD currency pair following a daily close below $0.6000.
Ready to trade our Forex weekly forecast? Here’s a list of some of the best Forex trading platforms to check out.
