The difference between success and failure in Forex / CFD trading is highly likely to depend mostly upon which assets you choose to trade each week and in which direction, and not on the exact methods you might use to determine trade entries and exits.
So, when starting the week, it is a good idea to look at the big picture of what is developing in the market as a whole, and how such developments and affected by macro fundamentals, technical factors, and market sentiment. There are several valid long-term trends in the market right now, which might be exploited profitably. Read on to get my weekly analysis below.
Fundamental Analysis & Market Sentiment
I wrote in my previous piece on 30th April that the best trade opportunities for the week were likely to be:
- Long of the EUR/USD currency pair following a bullish reversal on the H4 time frame rejecting $1.0920. This did not set up.
- Long of the NASDAQ 100 Index. This produced a profit of 0.23%.
- Long of the GBP/USD currency pair. This produced a profit of 0.60%.
My forecast produced an overall win of 0.83%, averaging a gain of 0.28%.
News about global financial markets is currently quite bullish, centered mainly on last week’s widely expected 0.25% rate hike by the Federal Reserve and the more dovish language in its statement hinting that there may be no further hikes to come in this tightening cycle. This led to lower-than-expected short-term rates which has boosted the US stock market and caused to US Dollar to sell off again, in line with long-term trends. However, Friday saw considerably stronger US jobs data than expected, which saw the week finish with speculation that the Fed may not be able to avoid at least one more hike at its meeting next month.
The second most important central bank after the Fed, the European Central Bank, also had a policy meeting last week, at which it raised its Main Refinancing Rate by 0.25% as expected, to 3.75%. President Lagarde hinted that further hikes would be forthcoming.
Markets will now be strongly focused on the coming release of US CPI (inflation) data on Wednesday, which will likely shed light on whether underlying US inflation will remain stuck roughly where it has been over the past few months, or whether it is now seeing a more meaningful decline.
The most important data released last week were:
- US Federal Funds Rate and FOMC Statement – the hike was as expected but the Statement’s language was more dovish, hinting at a willingness to keep rates on hold over the near term.
- ECB Main Refinancing Rate and Monetary Policy Statement – the hike was as expected and the Bank strongly hinted there would be more rate hikes to follow.
- US Non-Farm Employment Change – this saw a net new 253k jobs created (compared to only 181k expected) and the unemployment rate fall to a multi-decade low of 3.4%, while average hourly earnings increased by 0.5% when only 0.3% was expected. This very strong jobs data calls the idea of a rate hike pause by the Fed into question at the present time.
- RBA Cash Rate and Rate Statement – the RBA made a surprise rate hike of 0.25%, which gave the Australian Dollar a firm boost. This is a further piece of data which calls the idea of a Fed rate hike pause into question.
- Swiss CPI (inflation) – this came in lower than expected, with prices unchanged over the previous month, while an increase of 0.2% was anticipated.
Last week’s other key data releases were:
- US JOLTS Job Openings – this came in slightly weaker than expected, suggesting a slight cooling in the economy.
- US ISM Manufacturing PMI data – this came in just a little stronger than expected.
- New Zealand Unemployment Rate – this remained steady at 3.4% although it was expected to rise to 3.5%.
- US Unemployment Claims – the data was very close to expectations.
- Canadian Unemployment Rate- this remained steady at 5.0% although it was expected to rise to 5.1%.
The Week Ahead: 8th – 12th May
The coming week in the markets is likely to see a higher level of volatility thank last week, due to the highly important release of US CPI data. This week’s key data releases are, in order of importance:
- US CPI (inflation) data
- US PPI data
- Bank of England Official Bank Rate & Monetary Policy Report
- US Unemployment Claims data
- UK GDP data
- US Preliminary UoM Consumer Sentiment
- New Zealand Inflation Expectations data
Monday will be a public holiday in the UK and France.
Technical Analysis
US Dollar Index
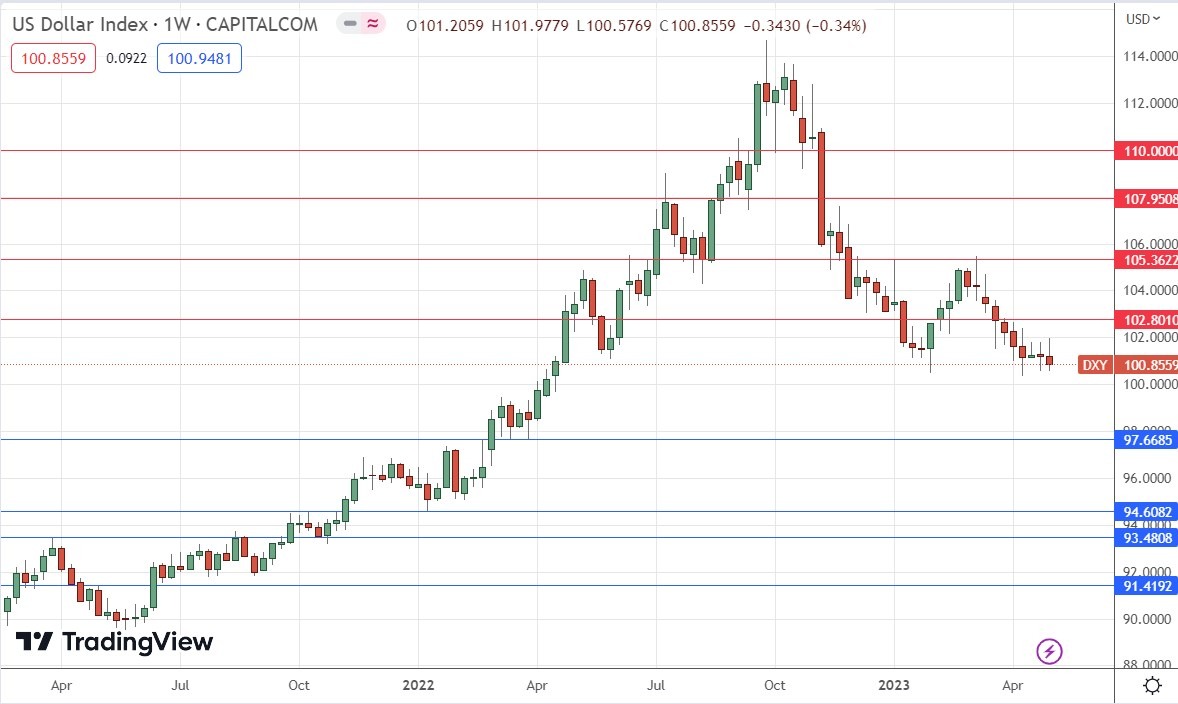
The weekly price chart below shows the U.S. Dollar Index fell again last week in line with its long-term bearish trend, although the week’s volatility remained relatively low.
The weekly candlestick is a bearish pin bar presenting the lowest weekly close seen in more than one year. This price action often signifies trend continuation when it is in-trend as it is here, suggesting we will see a further fall over the coming week.
The Dollar is likely to continue to fall over the coming week, although much will likely depend upon the release of US CPI (inflation) data this Wednesday. If the data shows a meaningful fall, we could see a sharp fall in the US Dollar as it has a lot of room to drop if it can get below its current area of historical bullish inflection.
NASDAQ 100 Index
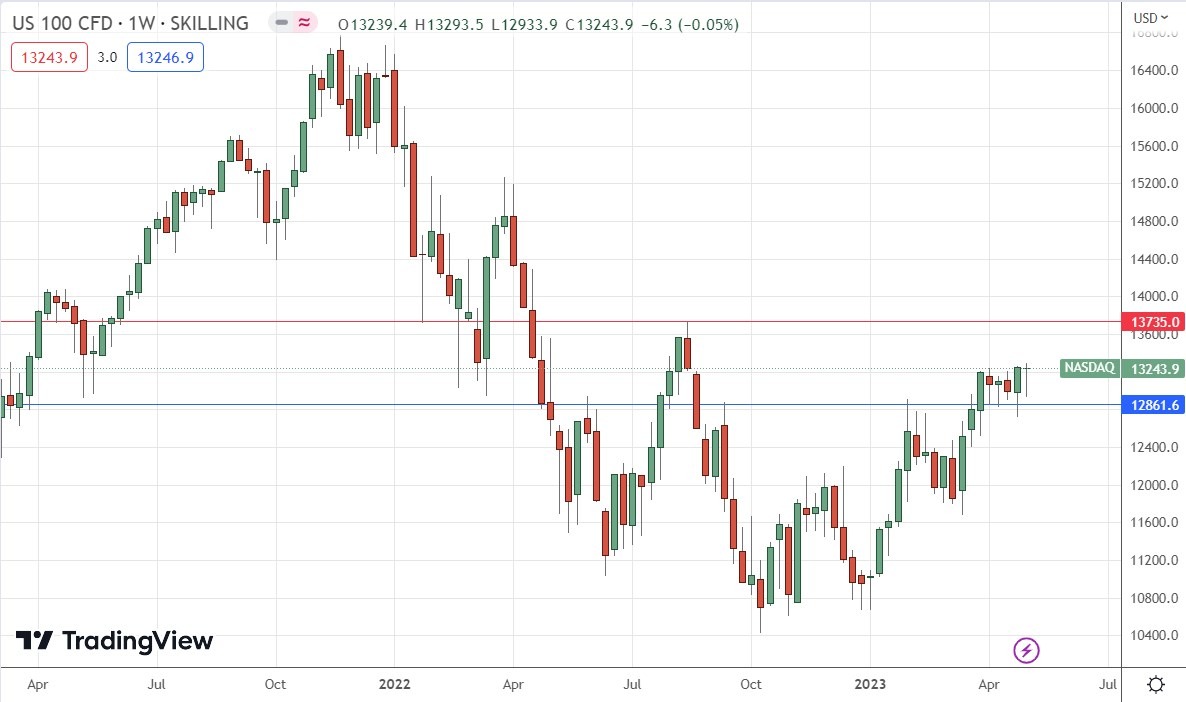
We saw a small rise in the NASDAQ 100 Index over the past week. The picture here is very bullish, for several reasons:
- We see the weekly candle which has just closed is a bullish pin bar.
- The weekly candlestick closed near its high price.
- The lower wick of the weekly candlestick again rejected an area near the support level which I had identified at 12861.6.
- The weekly candlestick again made its highest weekly close since August 2022, showing we have a bullish breakout situation, as well as a valid long-term bullish trend.
There are no key resistance levels until 13735, so the price has room to rise.
The NASDAQ 100 Index still looks like a buy.
EUR/USD
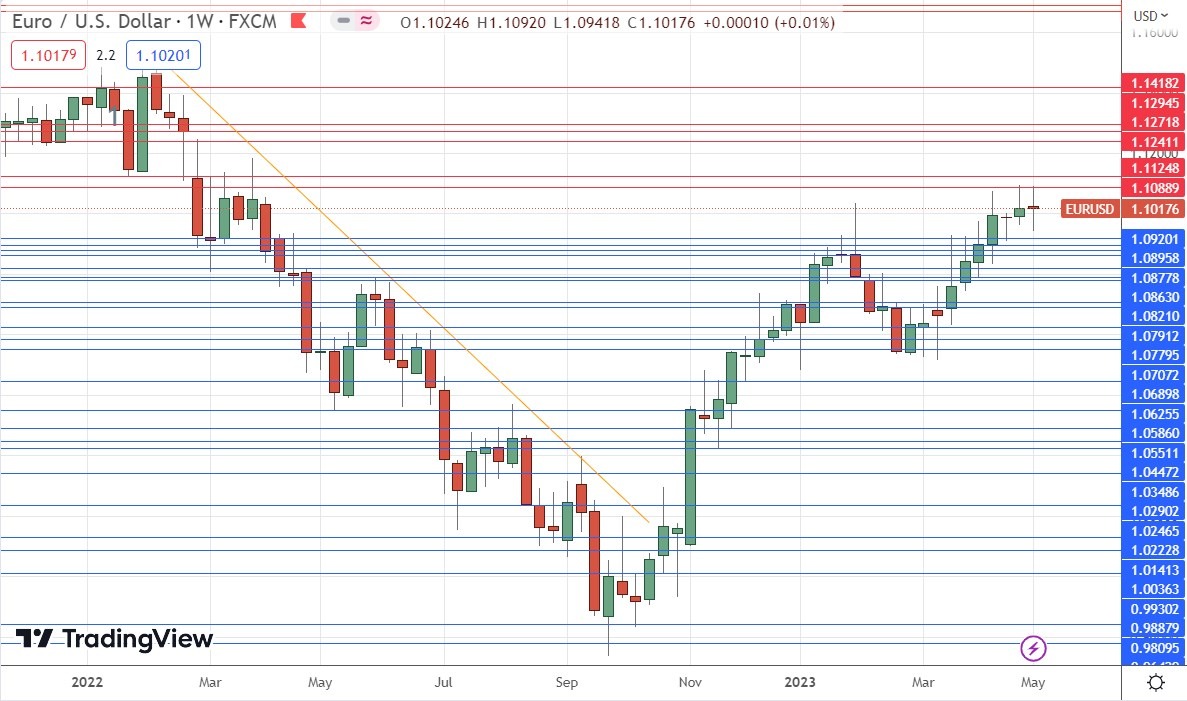
The EUR/USD currency pair printed a bearish doji candlestick, which often signifies indecision, which rejected the key resistance level identified at $1.1089.
The technical picture is a bit mixed. The bullish factors are the valid long-term bullish trend, and the weekly closing price coming in very close to the previous week’s 10-month high, also above the big round number at $1.1000. It is also a fact that this currency pair likes to make deep retracements within trends.
However, the bullish case is a bit weakened by the strong resistance below $1.1100, which seems to be holding firm again. Bears can also argue that the double top there with the weekly doji suggests that despite the weak USD, the price here does not want to rise, despite the ECB’s rate hike and relatively hawkish language about future hikes in its policy release last week.
Despite these bearish signs and the fact that the positively correlated British Pound is outperforming the Euro, I am still ready to enter a new long trade if we get a bounce at a key support level.
GBP/USD
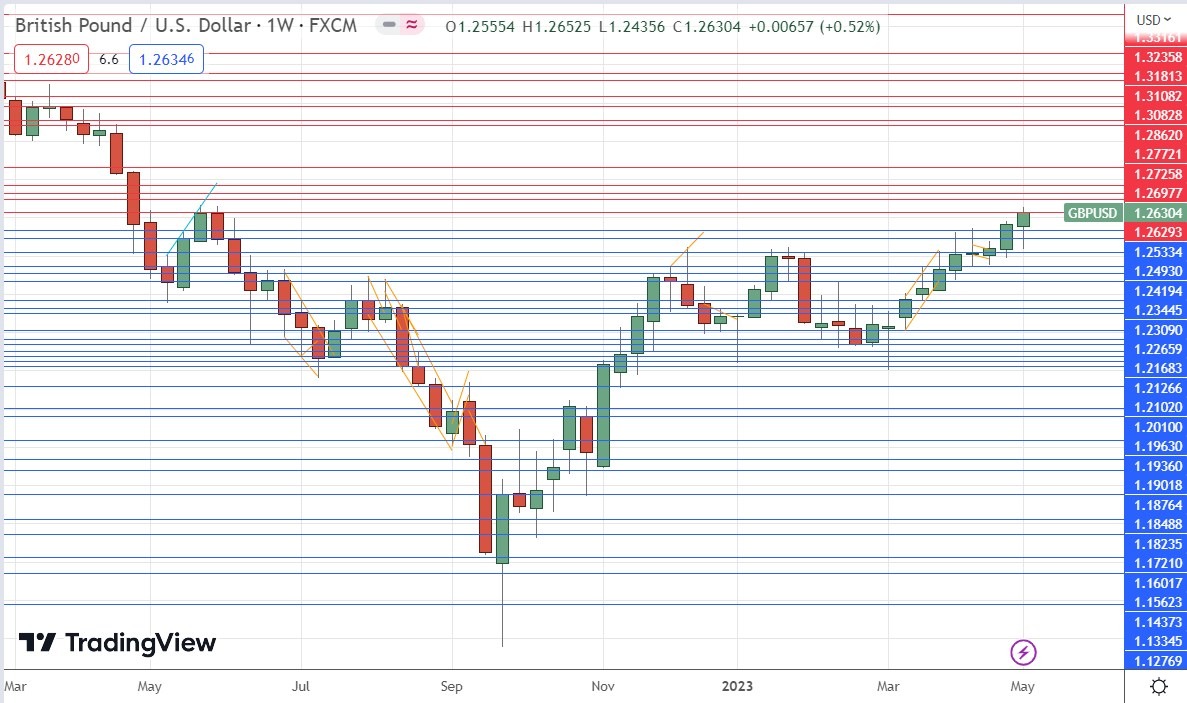
The GBP/USD currency pair rose slowly but firmly to make its ninth consecutive higher weekly close at a new 10-month high.
An additional bullish factor was that the British Pound was one of the strongest major currencies over the past week.
The British Pound is standing out as a reliably trending currency, and it has often fulfilled this role in the past, although there are questions over whether the US Dollar is technically ready to fall further. We will be likely to see any significant bearish breakdown in the USD triggered by lower-than-expected US CPI data on Wednesday.
Another thing to watch out for is the Bank of England’s policy release later this week, which could cause volatility in the Pound, especially if the Bank chooses to pass on the widely expected rate hike of 0.25% which is anticipated.
I remain bullish on this currency pair.
Gold
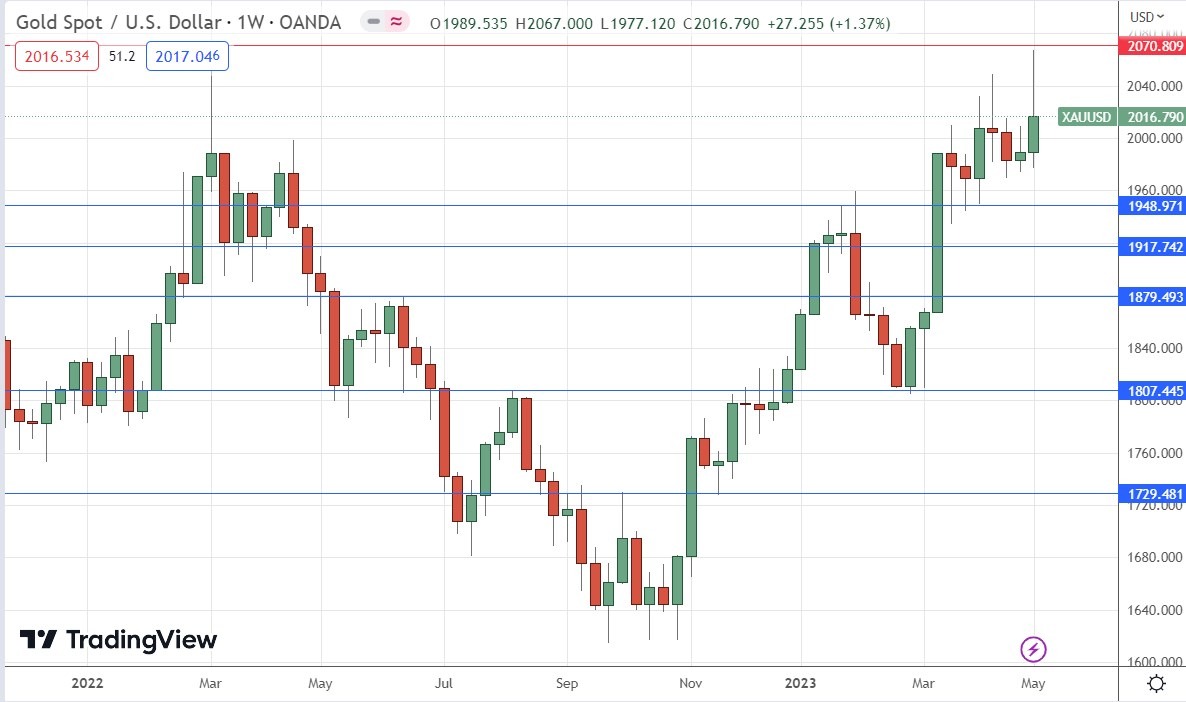
The price of Gold in USD terms rose over the past week to close above $2000 an ounce at its highest weekly close since August 2020. This came after the price came very close to equaling its all-time high at about $2,070 last Thursday, before if fell significantly on Friday.
We see a weekly candlestick in the price chart below which has a large upper wick which practically rejected the all-time high price. These factors could make bulls cautious, but bulls can point to the relatively high weekly close above the big round number and the persistent long-term bullish trend.
It is also worth remembering that although it tends to be seen as a hedge, the price of Gold is historically strongly positively correlated with the US stock market. So, as we see stocks rising again, we see Gold rising too, which arguably makes this move more solid.
I am weakly bullish on Gold, seeing the best opportunities as trading any reversals off recent daily lows on shorter time frames such as H4 or even H1.
CANE
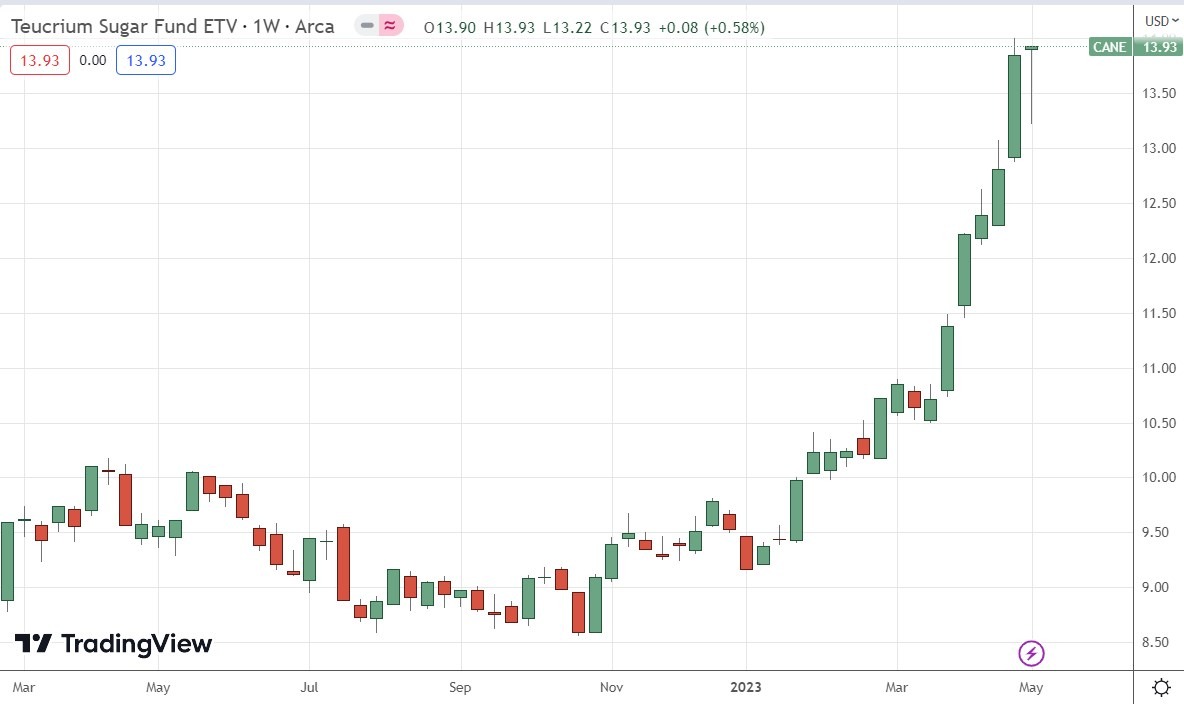
The Sugar ETF CANE has seen a more than 40% price rise since the start of 2023. After initially making quite a deep bearish retracement during the first part of last week, it bounced back to reclaim its eye-watering bullish momentum by the end of Friday, with the highest daily close for many years made near $14.00.
It is always difficult to forecast where such strong trends might reverse, but bulls should be aware the price has gone up by a lot and the trend could be seen to be very over-extended. I would therefore prefer to wait for a consolidation and subsequent bullish breakout before entering a new long trade here.
There may be likely resistance levels at $14.25 and at $15.00.
It has historically been very worthwhile trading new 6-month high breakouts in commodities, using a volatility-based trailing stop.
Bottom Line
I see the best trading opportunities this week as:
- Long of the EUR/USD currency pair following a bullish reversal on the H4 time frame rejecting $1.0920.
- Long of the NASDAQ 100 Index.
- Long of the GBP/USD currency pair.
Ready to trade our Forex weekly analysis? We’ve shortlisted the best Forex trading brokers in the industry for you.
