Top Forex Brokers
The difference between success and failure in Forex / CFD trading is highly likely to depend mostly upon which assets you choose to trade each week and in which direction, and not on the exact methods you might use to determine trade entries and exits.
So, when starting the week, it is a good idea to look at the big picture of what is developing in the market as a whole, and how such developments and affected by macro fundamentals, technical factors, and market sentiment. There are some strong long-term trends in the market right now, which might be exploited profitably.
Read on to get my weekly analysis below.
Fundamental Analysis & Market Sentiment
I wrote in my previous piece on 16th July that the best trade opportunities for the week were likely to be:
- Long of the NASDAQ 100 Index. The Index ended the week lower by 0.80%.
- Long of the EUR/USD currency pair. The pair ended the week lower by 0.90%.
- Long of the GBP/USD currency pair following a daily close above $1.3142 with the close in the top quarter of the day’s range. This did not set up.
- Long of CC1! Cocoa Future following a daily close above 3414. This trade set up on Wednesday, but the trade ended the week down by 0.52%.
My forecast produced an overall loss of 2.22%, averaging a loss of 0.56% per highlighted asset.
Market sentiment is dominated by a more bearish turn as the previous risk-on rally soured a bit, despite data last week showing that inflation fell in Canada, the UK, and New Zealand. The falls in the UK and Canada were stronger than expected, while the fall in New Zealand was weaker than expected. However, data later in the week showed weaker US retail sales which helped trigger a selloff of risky assets, which saw the US Dollar gain and stocks fall.
Markets will start the week focused on the expected 0.25% rate hikes at this week’s policy meetings by the US Federal Reserve and the European Central Bank. The Bank of Japan will also be holding a policy meeting later in the week.
Markets are likely to begin this week in the same risk-off condition which prevailed at the end of last week.
Last week’s other key data releases were:
- Chinese GDP and Industrial Production – these both showed an increase, but the GDP data was lower than expected.
- US Empire State Manufacturing Index – better than expected.
- Reserve Bank of Australia Monetary Policy Meeting Minutes – this was seen as a bit hawkish as the minutes acknowledged that the decision not to hike was very close.
- US Unemployment Claims – almost exactly as expected.
- Australian Unemployment Rate – remained unchanged at 3.5% when a rise to 3.6% had been expected.
The Week Ahead: 24th July – 28th July
The coming week in the markets is likely to see a higher level of volatility than last week, as there are three major central bank meetings scheduled. This week’s key data releases are, in order of importance:
- US Federal Funds Rate and Rate Statement
- European Central Bank Main Refinancing Rate and Monetary Policy Statement
- Bank of Japan Policy Rate, Monetary Policy Statement, and Outlook Report
- US Advance GDP
- US Core PCE Price Index
- US CB Consumer Confidence
- US Revised UoM Consumer Sentiment
- US, UK, German, French Flash Services and Manufacturing PMI
- Australian CPI (inflation) data
- Canadian GDP
- US Unemployment Claims
- US Employment Cost Index
Technical Analysis
US Dollar Index
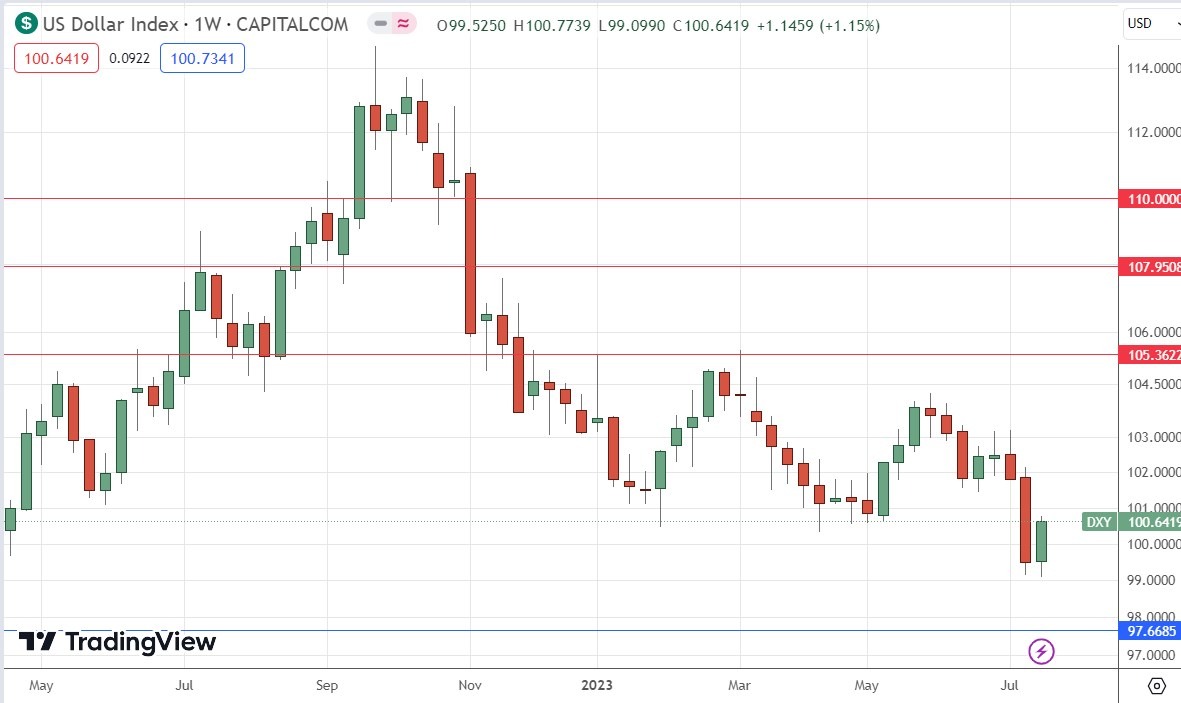
The weekly price chart below shows the U.S. Dollar Index printed a bullish candlestick last week after having fallen sharply to a new 15-month low. The candlestick has little upper wick and closed not far from the halfway mark of the previous week’s range.
Although the Dollar is showing some short-term bullish momentum, it should be noted that there is not really a fundamental drive for this rebound, and that the long-term trend is clearly bearish. However, with the Fed holding an important policy meeting this week, it is difficult to predict the US Dollar’s short-term direction now.
NASDAQ 100 Index
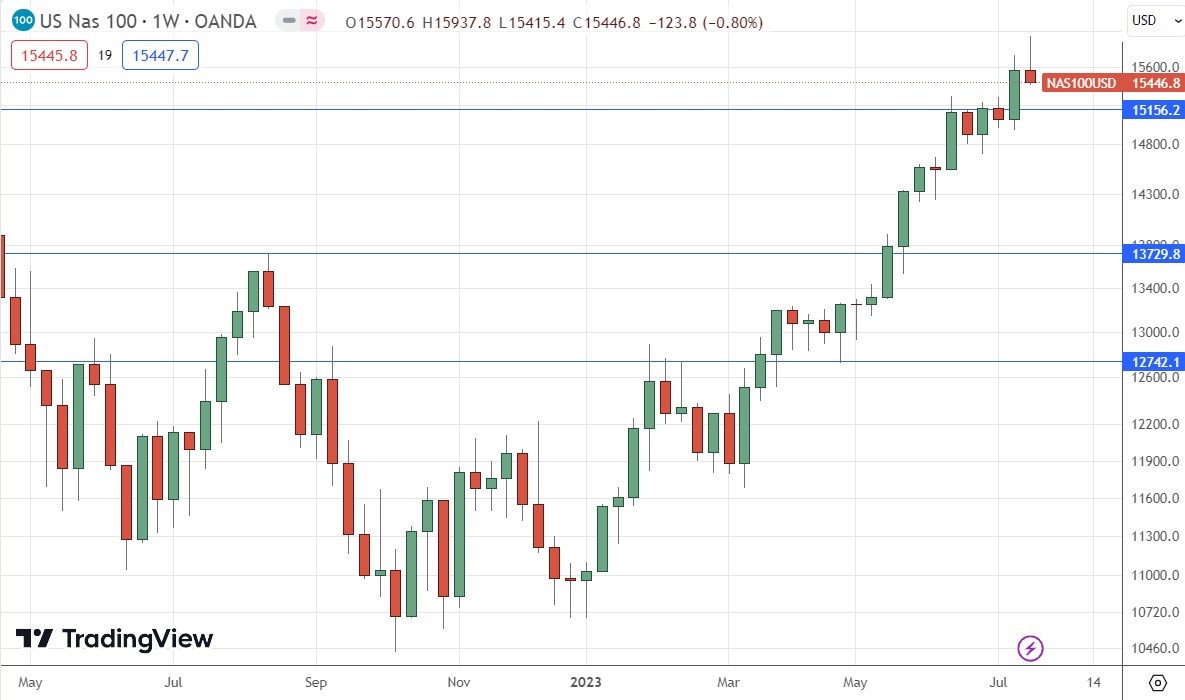
Last week saw quite a drop in the price of the NASDAQ 100 Index after reaching a new 18-month high. The week closed down, printing a pin bar, which can be argued to have rejected an area of resistance. The candle closed very near the low of its range, and these facts are bearish.
The price may be oversold and due a deeper retracement, but it is important to remember that there is a strong long-term bullish trend that has seen massive gains during 2023, when this Index has increased in value by approximately 40%.
The next thing to watch will likely be where the price will stay above the former resistance level at 15156.2 which will now be likely to function as support.
It may be wise to stand aside for the time being while we see how much deeper this retracement goes.
A bullish bounce at the support level of 15156.2 could be a good entry opportunity to enter a new long trade.
EUR/USD
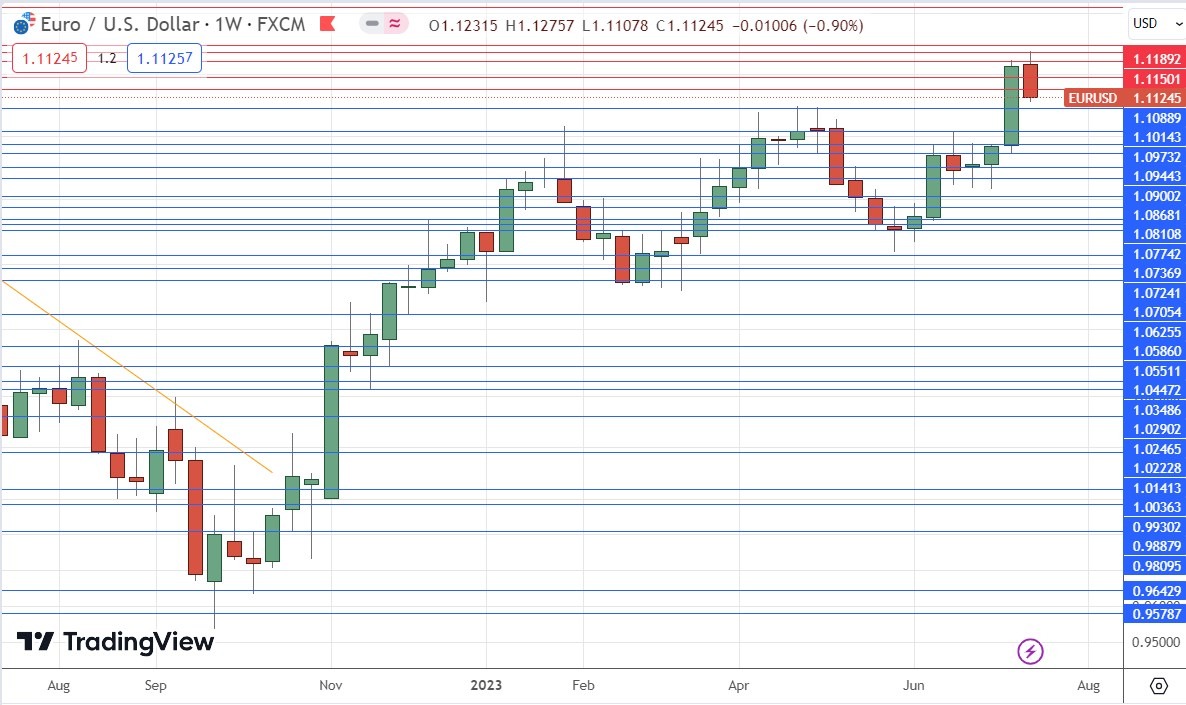
The EUR/USD currency pair fell last week after making its highest weekly close since February 2022 at the end of the previous week, and the week’s price action also made a new 16-month high price.
Although we saw the US Dollar make a comeback last week against almost every major currency, the Euro has fallen by less than most and is showing a little bit of relative strength.
This currency pair loves to make deep pullbacks, so it may be better to enter long after a strong bullish bounce within the bearish retracement.
This pair will still be attractive to trend traders now on the long side, as it has tended to trend reliably.
USD/JPY
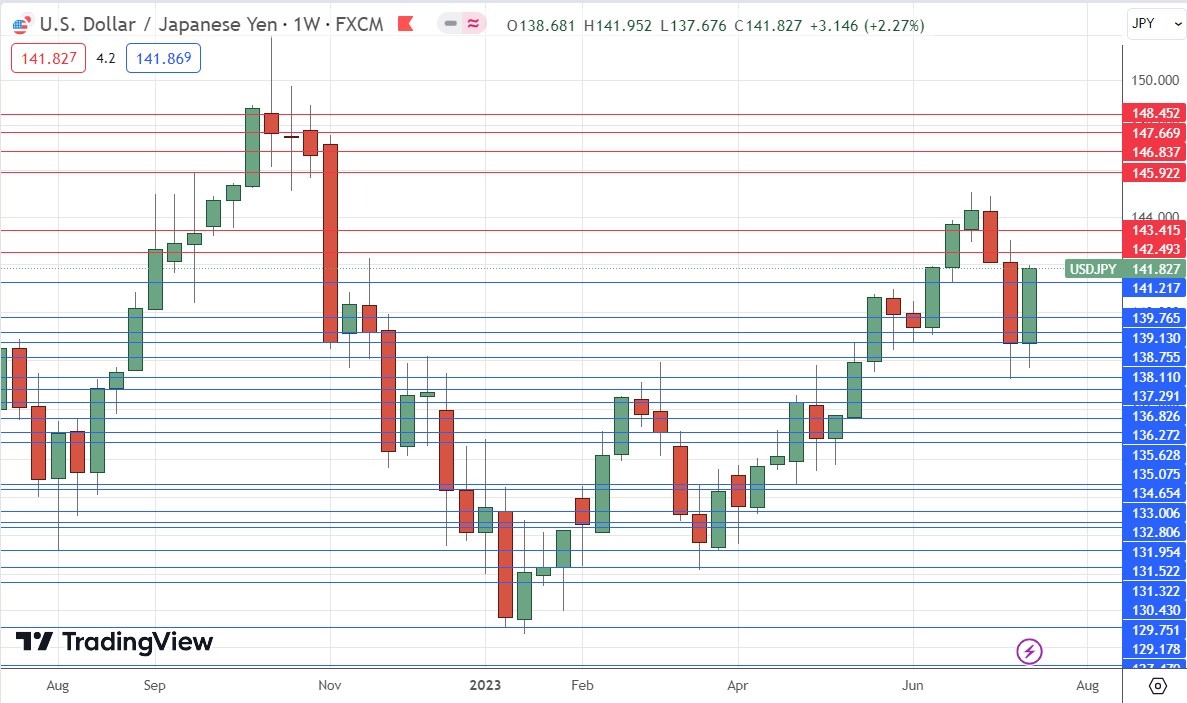
The USD/JPY currency pair rose strongly last week as the US Dollar made a strong comeback, and the Japanese Yen weakened strongly as the Bank of Japan backpedaled on its rhetoric about tapering off its ultra-loose monetary policy.
We see strong short-term bullish momentum here and quite a lot of volatility which will make this currency pair interesting to traders, but it is not in a valid long-term trend which makes direction quite uncertain here.
This pair will likely be best suited to short-term trading opportunities based on sentiment and momentum.
Cocoa
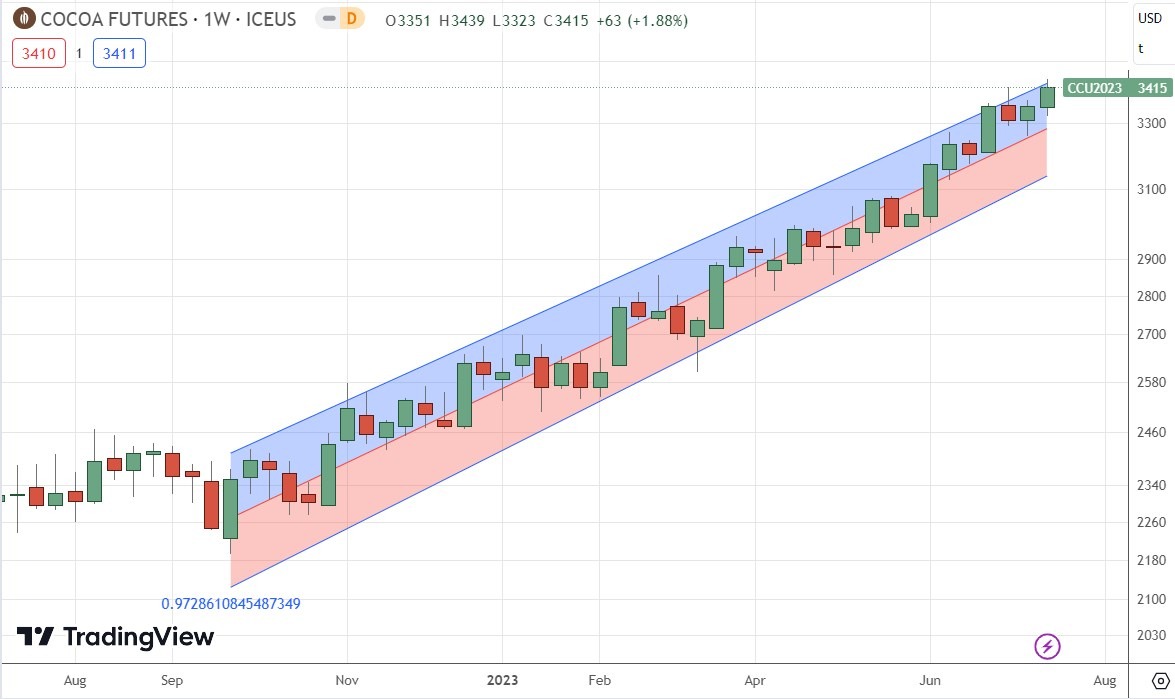
The price of Cocoa has been advancing strongly for a long time – since October 2022 – with a firm and predictable bullish trend. The price has risen by more than about 50% during this period, which is a large rise.
The Cocoa futures price chart below shows a linear regression analysis study applied to the trend since October, showing the price action is very predictable and has remained within the regression channel. This is suggestive of a persistent trend.
The price rose last week and broke to a new significant multi-year high price. This is a bullish breakout and might be a good signal to enter a new long trade.
There is strong global demand for cocoa and problems with some crops in Africa which are helping to drive the price higher.
Cocoa futures remain a buy.
Bottom Line
I see the best trading opportunities this week as:
- Long of the NASDAQ 100 Index if we get a bullish bounce from 15156.2 following a deeper bearish retracement.
- Long of the EUR/USD currency pair if we get a strong bullish bounce at a plausible supportive area.
- Long of CC1! Cocoa Future.
Ready to trade our Forex weekly forecast? Here’s a list of some of the best Forex trading platforms to check out.
