The difference between success and failure in Forex / CFD trading is highly likely to depend mostly upon which assets you choose to trade each week and in which direction, and not on the exact methods you might use to determine trade entries and exits.
So, when starting the week, it is a good idea to look at the big picture of what is developing in the market as a whole, and how such developments and affected by macro fundamentals, technical factors, and market sentiment.
Read on to get my weekly analysis below.
Fundamental Analysis & Market Sentiment
I wrote in my previous piece on 3rd September that the best trade opportunities for the week were likely to be:
- Long of USD/JPY. The currency pair saw an increase of 1.05%.
- Long of WTI Crude Oil futures. The future saw an increase of 1.34%.
The total profit was 2.39%, representing an average gain per asset of 1.19%.
Over the past week, market sentiment concerning the USA has begun to waver. Sentiment was positive one week ago as data seemed to show the US economy was cooling down, removing the need for any further rate hikes by the Fed. However, there is now a growing feeling, supported by the latest releases of US economic data, that the US economy is not cooling sufficiently, and that CPI (inflation) data due this week will show a continuation of rather than a reduction in inflationary pressure. This could make it more likely that even if the Fed does not hike rates at its meeting later this month, it may do so at its subsequent meeting in November.
Markets will be looking ahead to the releases of US CPI (inflation) data this week, and the policy meeting at the European Central Bank. Year on year inflation is expected to rise again from 3.2% to 3.6%, while the ECB is expected to keep its interest rate on hold at 4.25%.
Last week, there was little data of high importance to the Forex market released last week, and as a consequence, directional volatility in the market was very low.
Last week’s major events were policy releases by the Bank of Canada and the Reserve Bank of Australia. Both Banks left rates unchanged, as expected, but the Bank of Canada’s rhetoric was a bit more hawkish than was expected. However, overall, the policy releases had little effect on their currencies.
Last week also saw the US Dollar continue to look strong, and several commodities rise, most notably WTI Crude Oil which has broken to a new multi-month high price.
Last week’s other key data releases were:
- Australian GDP – met expectations.
- US Unemployment Claims – slightly better than expected.
- US ISM Services PMI - slightly better than expected.
- Canadian Unemployment Rate - slightly better than expected.
- Chinese CPI (inflation) - slightly better than expected.
The Week Ahead: 11th September – 15th September
The coming week in the markets is likely to see a considerably higher level of volatility than last week, as we will see the final end of the summer season and a return to a market with higher volumes. This week’s key data releases are, in order of importance:
- US CPI (inflation)
- US PPI
- US Retail Sales
- US Preliminary UoM Consumer Sentiment
- European Central Bank Main Refinancing Rate & Rate Statement
- US Unemployment Claims
- Chinese Industrial Production
- US Empire State Manufacturing Index
- UK GDP
- UK Claimant Count Change
- Australian Unemployment
Technical Analysis
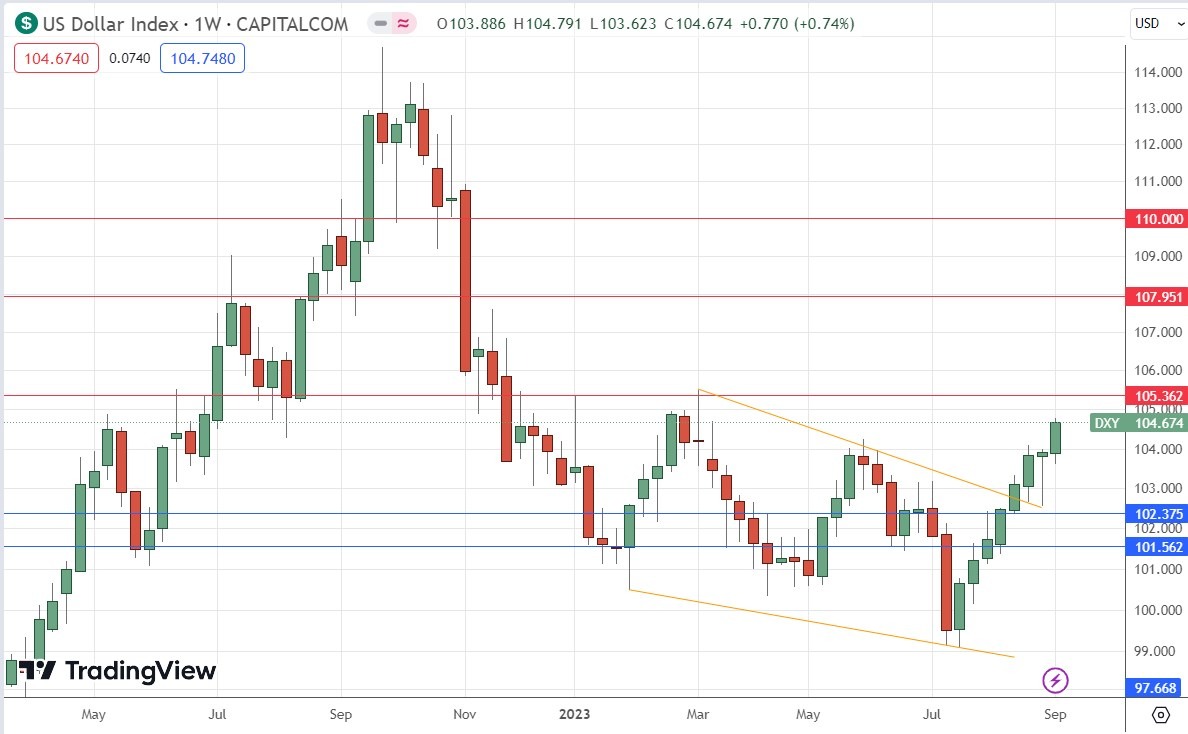
US Dollar Index
The week price chart below shows the U.S. Dollar Index advanced strongly last week for the eighth consecutive week, to close at a near 6-month high price, continuing its long-term bullish trend. A few weeks ago, it made a bullish breakout beyond the upper trend line of a long-term descending wedge pattern, as I had forecasted.
The price ended the week near the high of its range. This is a bullish sign, but it should be noted that the price is approaching a pivotal area of resistance above 105.
The Dollar is in a long-term bullish trend evidenced by the price trading above its levels from 3 months and 6 months ago.
I see the US Dollar as having bullish momentum, which means it is probably a good idea to only look for long trades in the US Dollar this week.

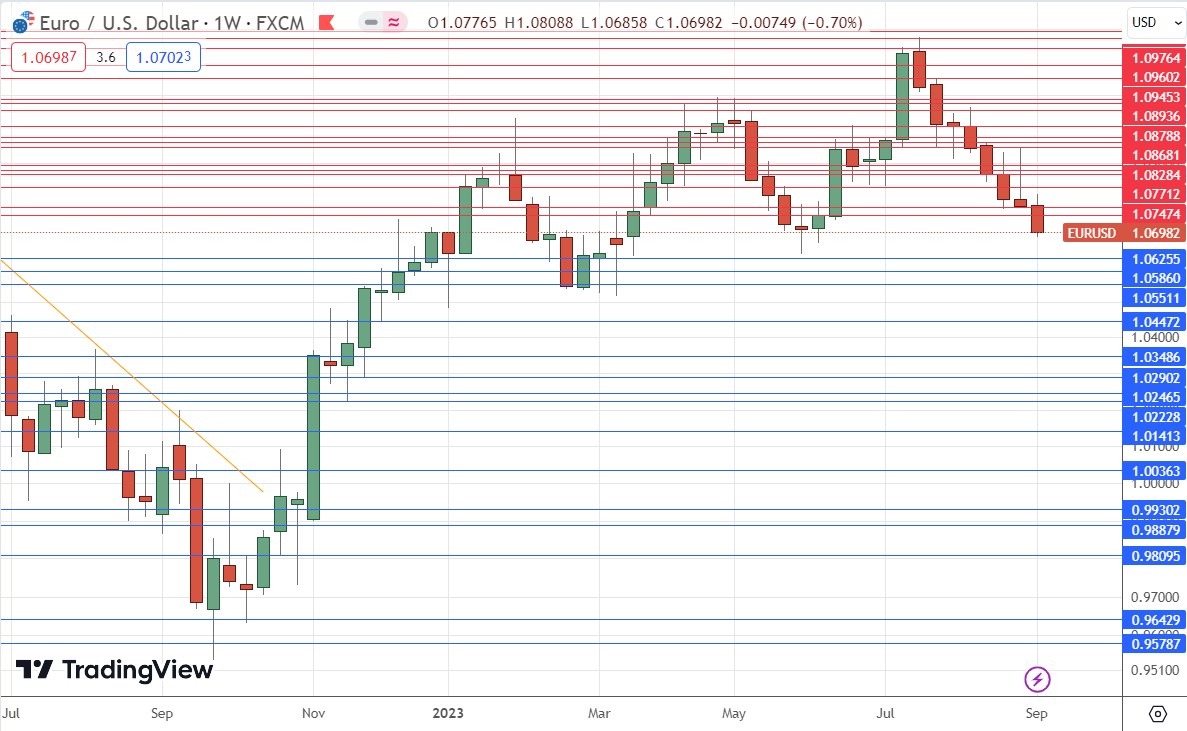
EUR/USD
The EUR/USD currency pair printed a bearish candlestick, which closed near its low, making the lowest weekly close in 6 months.
Despite these bearish factors, I recommend traders proceed very cautiously here, as the price still needs to break below the cluster of support levels above and around the round number of $1.0600 before it really starts to look properly bearish. We might see a bullish reversal here instead, as this area was very pivotal when it was last reached some weeks ago.
There is another uncertain factor which is that the European Central Bank will be holding a policy meeting, which might produce a surprise in language or monetary policy, although it is very unlikely that the interest rate will be changed from 4.25%.
This pair may be a good candidate to day trade short if it is retracing to resistance, but longer-term traders should wait for sub-$1.0600 prices before going short.

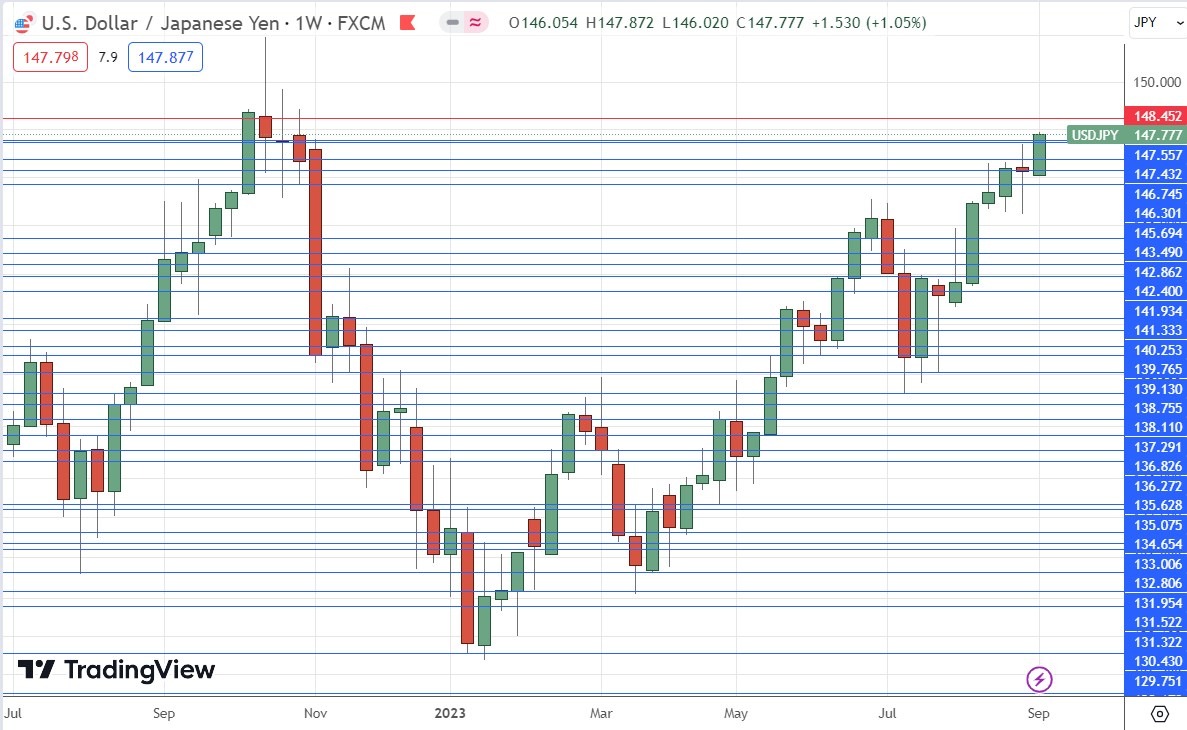
USD/JPY
The USD/JPY currency pair printed a bullish engulfing candlestick which reached the highest price seen in 10 months, showing that the long-term bullish trend which has been running since the start of 2023 is still going strong.
I still see this currency pair as a long-term buy due to the very loose monetary policy of the Bank of Japan, as well the long-term downwards trend in the Yen. With the US Dollar remaining strong, this currency pair is at the heart of the Forex market, and it has been possible to make quite easy profits here in recent days and weeks.
Bulls should only worry about two things:
- Some rhetoric over the weekend from the Bank of Japan that it might not maintain negative rates once inflation has been brought down to its 2% target.
- The big round number at ¥150 produced a strong bearish reversal the last time it was reached – it could do so again.

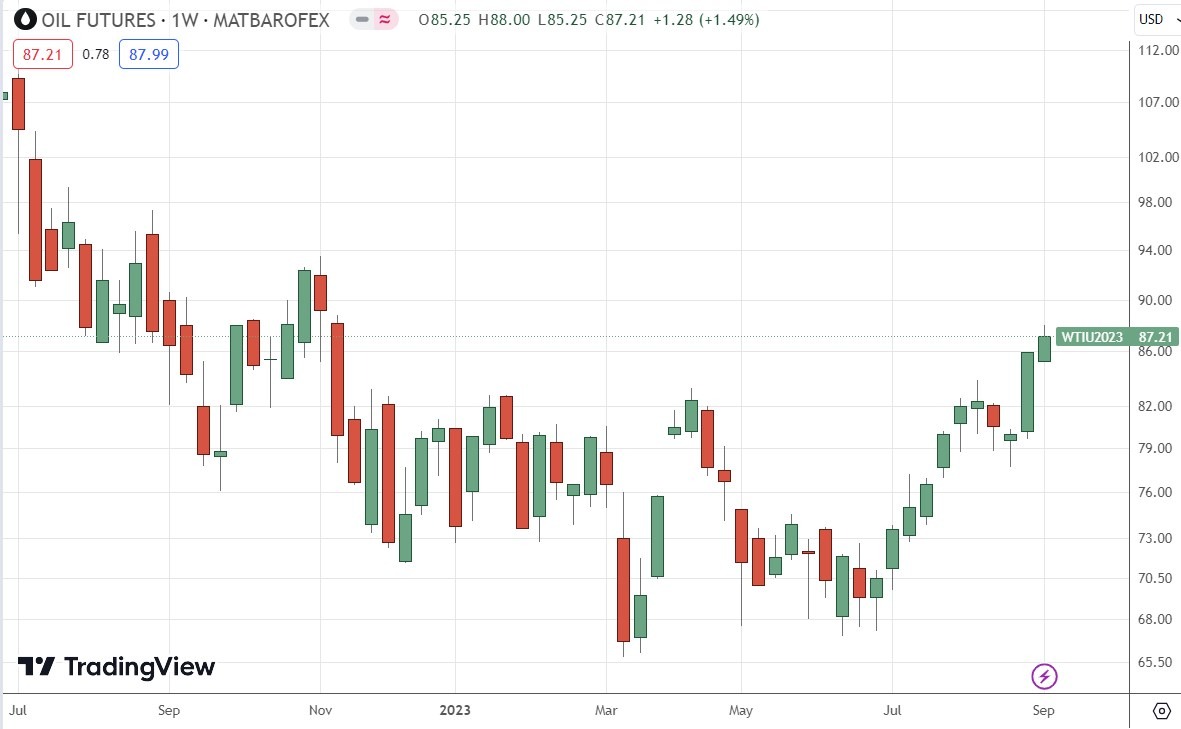
WTI Crude Oil
The current WTI Crude Oil future made another bullish move over the past week, closing at its highest weekly close in 9 months. This is a clear volatility breakout from a dominant price range.
The growing optimism that the Fed is done with rate cuts is fading, which has probably helped to slow the bullish momentum here, which was stronger last week. However, OPEC has recently announced the continuation of some supply restrictions, which is a bullish factor.
Trend trading commodities long when they make bullish breakouts to new long-term high prices has historically been a very profitable trading strategy.
I still see WTI Crude Oil as a buy. However, this rally might not have much further to run.

Bottom Line
I see the best trading opportunities this week as long of USD/JPY and of WTI Crude Oil.
Ready to trade our weekly Forex analysis? We’ve made a list of the best brokers to trade Forex worth using.
