Top Forex Brokers
The difference between success and failure in Forex / CFD trading is highly likely to depend mostly upon which assets you choose to trade each week and in which direction, and not on the exact methods you might use to determine trade entries and exits.
So, when starting the week, it is a good idea to look at the big picture of what is developing in the market as a whole, and how such developments and affected by macro fundamentals, technical factors, and market sentiment.
Read on to get my weekly analysis below.
Fundamental Analysis & Market Sentiment
I wrote in my previous piece on 8th October that the best trade opportunities for the week were likely to be:
- Long of the USD/JPY currency pair following a new daily close above ¥150.
- Short of the EUR/USD currency pair following a new daily close below $1.0500.
- Short of Gold following a new daily close below $1800.
None of these trades set up.
Last week overall saw a continued risk-off rally, driven partly by slightly higher than expected US inflation (US CPI came in at 3.7% compared to the forecasted 3.6%), partly by statements from FOMC implying there will be another rate hike in 2023, and partly by the continuing war in the middle east between Israel and Gaza which could widen dramatically at any point. The Swiss Franc and Gold were major gainers as safe havens, but other risk-off assets such as the US Dollar and Japanese Yen also gained.
Last week was quite light in terms of major data releases, with the major events being the US CPI and PPI data releases which showed inflationary pressure in the US economy is stronger than was thought. There was also a release of the most recent FOMC minutes from the USA which suggested there is still strong support at the Fed for a further rate hike in 2023.
The general election in New Zealand has produced a change of government, with the Conservatives gaining a majority and ousting the Liberal government which has ruled for the past 6 years.
Last week’s other key data releases were:
- UK GDP – came in as expected.
- US Preliminary UoM Consumer Sentiment – worse than expected.
- US Unemployment Claims – as expected.
- China CPI (inflation) – lower than expected.
The Week Ahead: 16th October – 20th October
The coming week in the markets is likely to see a lower level of volatility than last week, as there will be fewer highly important economic data releases. This week’s key data releases are, in order of importance:
- US Retail Sales
- UK CPI (inflation)
- Canadian CPI (inflation)
- New Zealand CPI (inflation)
- Australian RBA Monetary Policy Meeting Minutes
- US Unemployment Claims
- US Empire State Manufacturing Index
- UK Retail Sales
- UK Claimant Count Change
- Australian Unemployment Rate
- China Industrial Production
Technical Analysis
US Dollar Index
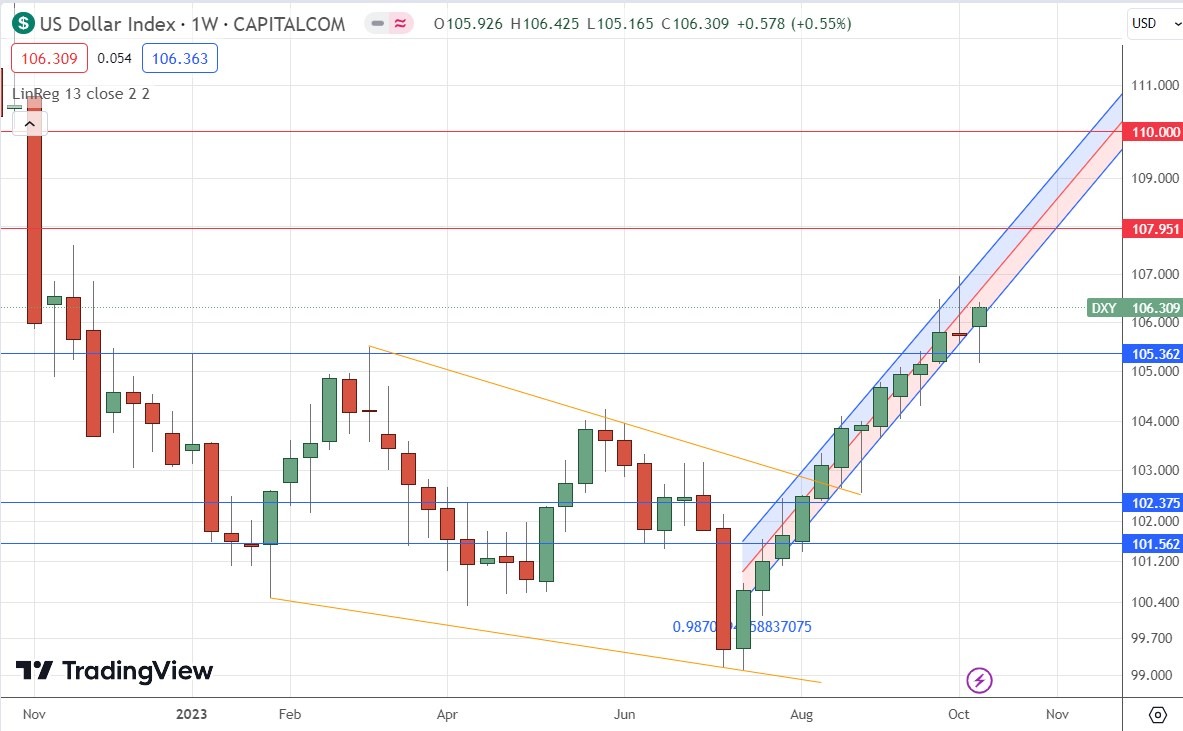
The US Dollar Index printed a bullish hammer candlestick last week, making its highest weekly close in 11 months. The price closed very near the high of its range. These are bullish signs, as is the fact that the support level at 105.36 was tested and held.
The price has been rising for almost three months every week except for the week before last, as shown by the linear regression analysis channel which I have added to the price chart below.
The US CPI (inflation) data released last week showed inflation running higher than expected, and this was supported by other prices data. Furthermore, the Fed is seeming to indicate there will be another rate hike of 25 bps before the end of 2023. These factors, plus the war in the middle east which has produced a minor flow into safe haven assets, are strengthening the greenback.
I would only look to take trades in the Forex market which are long of the US Dollar over the coming week.
USD/JPY
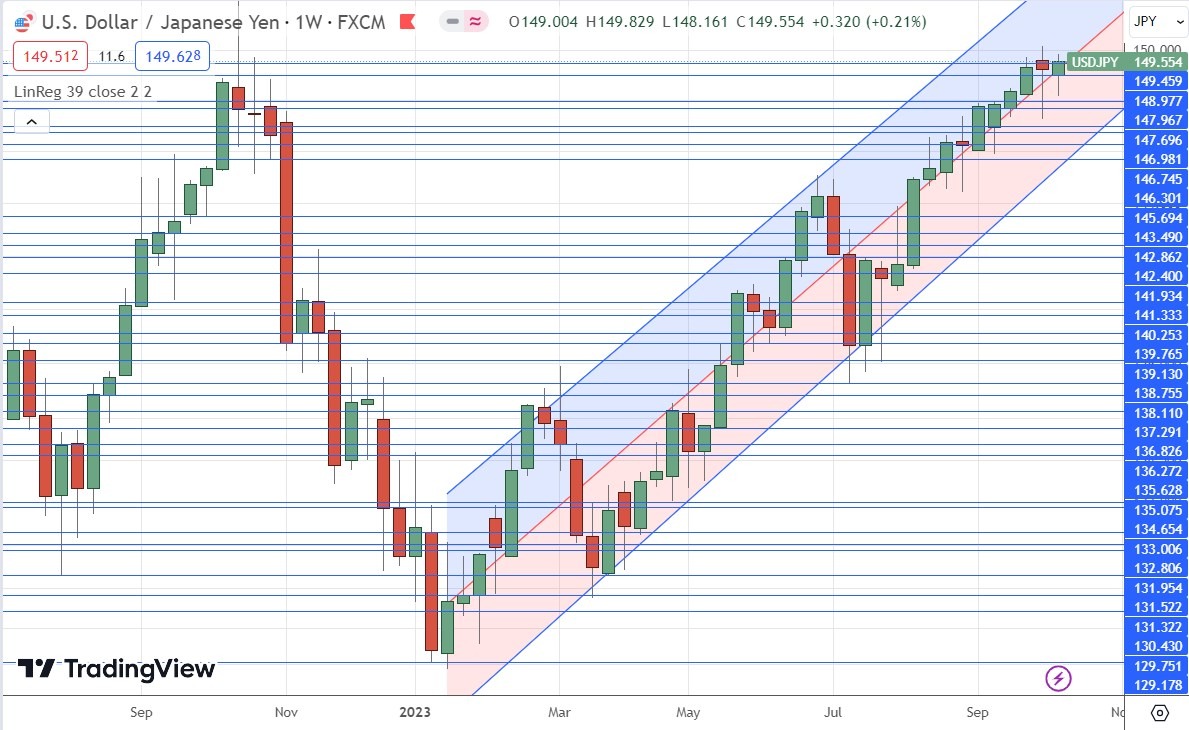
The USD/JPY currency pair made its highest weekly close in more than a decade. However, it did not make a new high above the big round number at ¥150.
I still see this currency pair as a long-term buy due to the very loose monetary policy of the Bank of Japan, as well the long-term downwards trend in the Yen.
The US Dollar is also strong, and I think will be boosted even more if the war in the middle east widens this week, which markets are seeming to discount, so I think the chance for a surprise is to the upside.
However, bulls should be wary of the Bank of Japan intervening to buy the Yen if and when it gets above ¥150.
I would enter a new long trade in this currency pair only after a firmly bullish daily close above that level.
EUR/USD
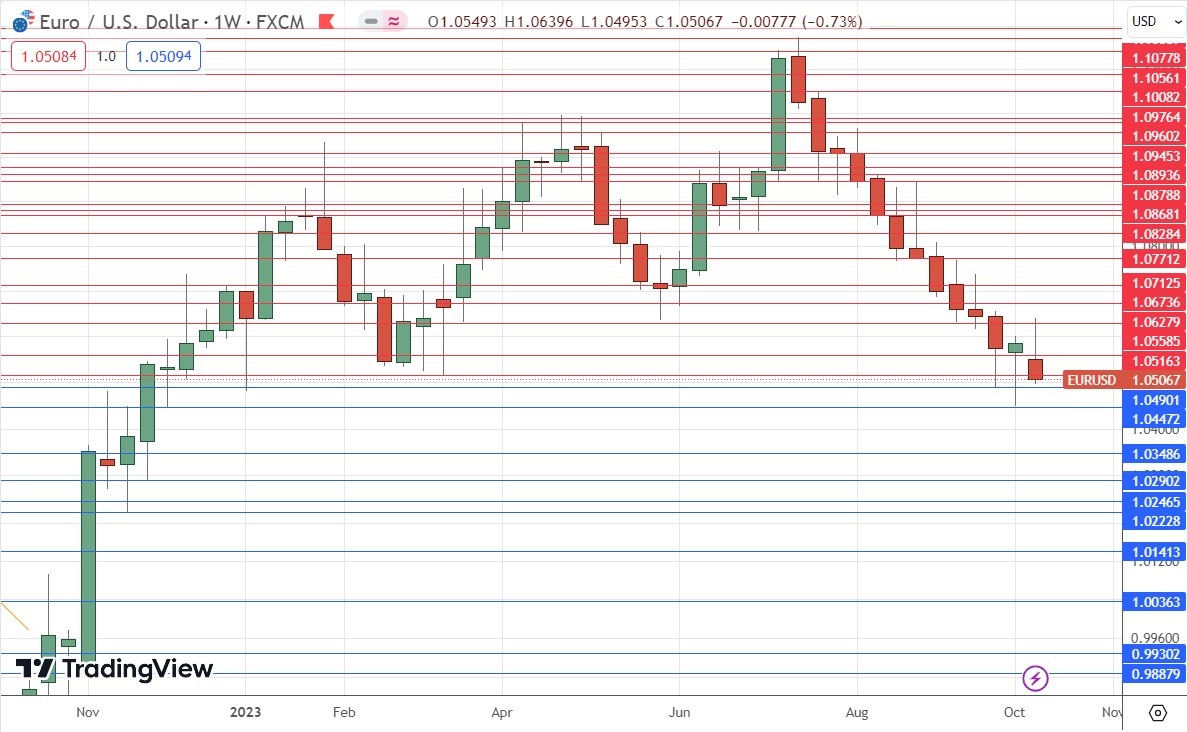
The EUR/USD currency pair declined last week, printing a bearish hammer candlestick which made the lowest weekly close seen in 11 months. The price closed very near the low of the week’s range. These are bearish signs.
It has seemed over the past few weeks that there is buying below $1.0500 so bears may be wise to wait for a strongly bearish daily close below that round number before entering a new short trade. There was also strong support here 11 months ago.
It is worth noting that the very long-term view of the chart does not show a truly solid downwards trend. A major reversal in the $1.0500 area is quite possible, especially as the USD/JPY currency pair is close to the big round number at ¥150.
GBP/USD
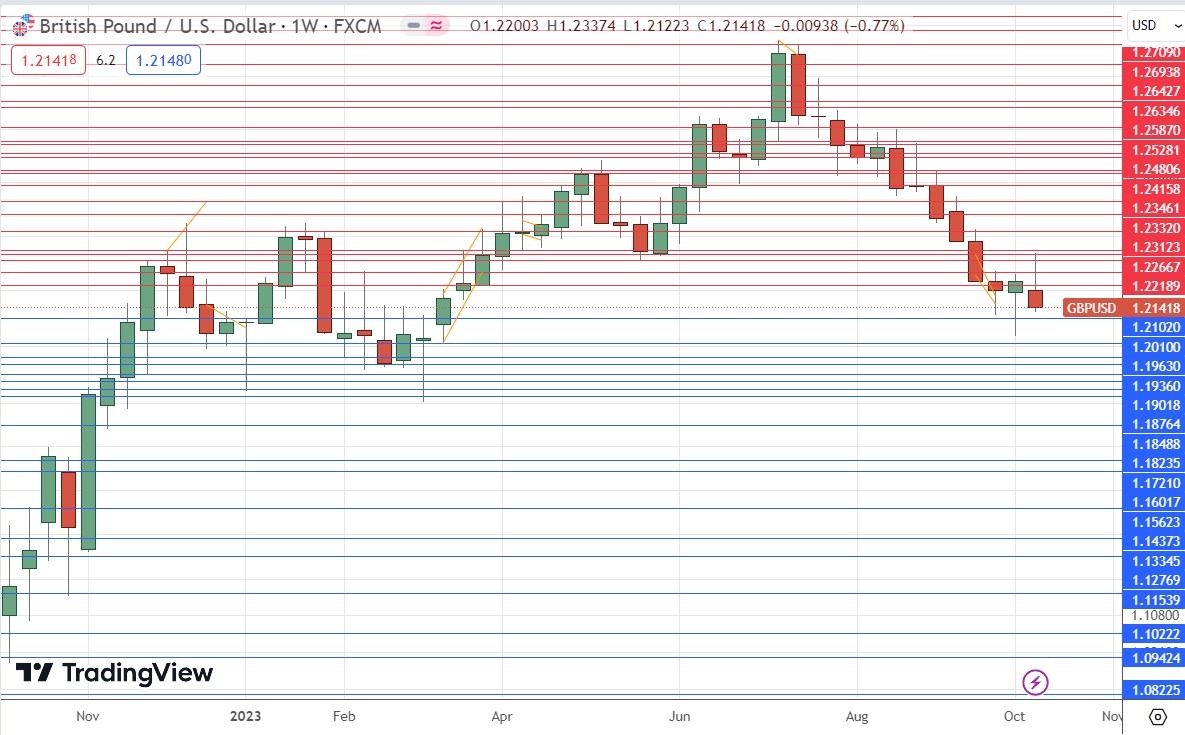
The GBP/USD currency pair declined last week, printing a bearish hammer candlestick which made the lowest weekly close seen in 11 months. The price closed very near the low of the week’s range. These are bearish signs.
Despite the seemingly bearish picture, it is notable that we have seen strong support in the $1.2000 to $1.2100 area over both the long and short term. When you consider that the Dollar is also facing major technical pivotal points against the Euro and the Japanese Yen, the technical scope for a major reversal in the US Dollar from this area certainly exists. Yet the bullish trend in USD is dominant now.
It is also worth noting that the very long-term view of the chart does not show a truly solid downwards trend.
Gold
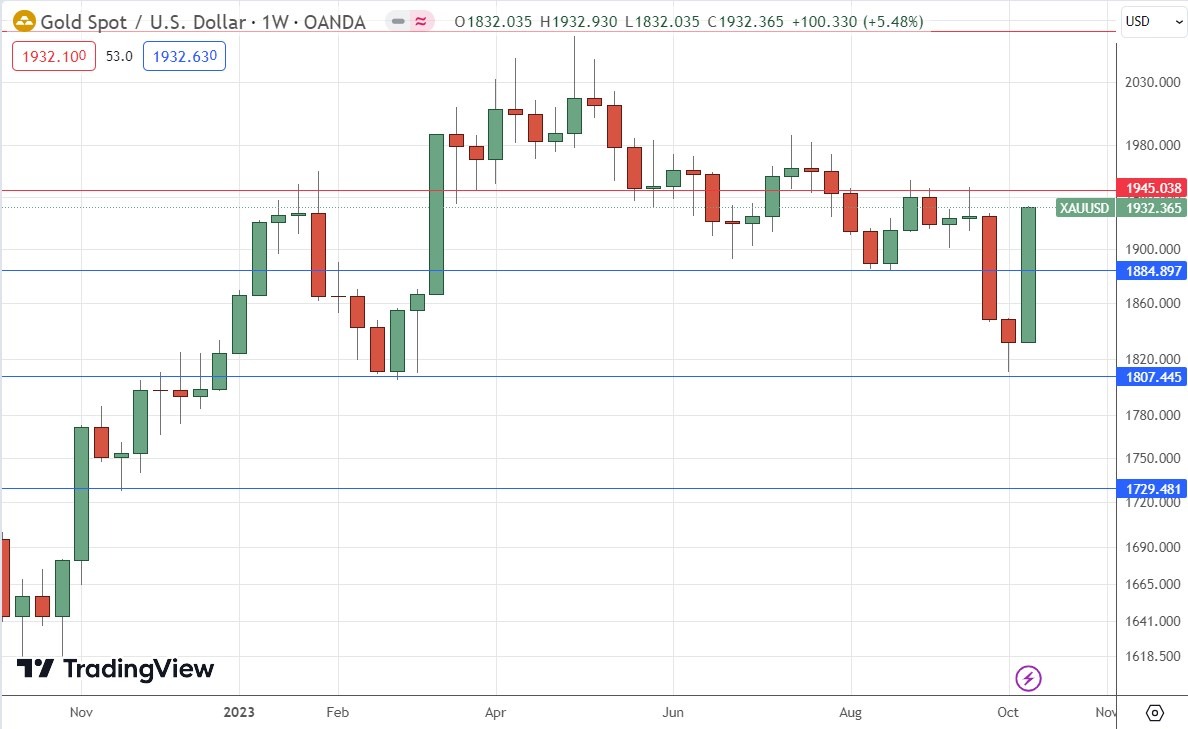
Gold was the standout market gainer of last week, after trading at long-term lows very close to an area of support confluent with the round number at $1800.
The price rose very strongly, and closed right on its high, so we see strong bullish momentum here.
Another reason why the rise in Gold is notable is that stock markets, with which Gold is usually highly positively correlated, ended last week mostly lower, so it seems that Gold is acting as a safe haven and a hedge against the middle east war widening. I think the markets are underestimating the chance of the war widening, so Gold could be a good hedge against that.
Technically, Gold does not look like a good buy right now, as it is near resistance and in a zone which has been consolidative.
Bottom Line
I see the best trading opportunities this week as:
- Long of the USD/JPY currency pair following a new daily close above ¥150.
- Short of the EUR/USD currency pair following a new daily close below $1.0500.
Ready to trade our Forex weekly analysis? We’ve shortlisted the best Forex trading brokers in the industry for you.
