Fundamental Analysis & Market Sentiment
I wrote on 5th May that the best trade opportunities for the week were likely to be:
- Long of the AUD/JPY currency cross. This gave a win of 1.21%.
- Long of the CAD/JPY currency cross. This gave a win of 1.97%.
- Long of the CHF/JPY currency cross. This gave a win of 1.69%.
- Long of the EUR/JPY currency cross. This gave a win of 1.90%.
- Long of the GBP/JPY currency cross. This gave a win of 1.68%.
- Long of the NZD/JPY currency cross. This gave a win of 2.00%.
The overall result was a net win of 10.45%, resulting in a win of 1.74% per asset.
The last weeks saw lower volatility in the Forex market.
Last week’s key takeaway was the souring of risk-on sentiment due to expectations in the USA of higher inflationary pressure over the short-term as well as US Consumer Sentiment data which came in at a six-month low. This souring did not come until the end of the week, and it is unclear how negative it is, as most assets over the entire week showed a risk-on rally.
It is unclear what sentiment will be like as the new week gets underway. It is likely that markets will be so fixated on the upcoming US CPI data release that nothing much will happen in the market before that.
The two major data releases last week were policy meetings at two central banks: the Bank of England and the Reserve Bank of Australia. Both central banks kept their interest rates unchanged, but the Bank of England vote was a little more dovish than expected. The RBA stated that inflation risk remains to the upside but that on balance they considered another rate holding to be the correct action. However, both banks effectively indicated a rate hike was out of the question.
Other important data releases were:
- US 30-Year Bond Auction – this produced a slightly lower yield, which should be slightly bullish for risk.
- UK GDP – this came in notably better than expected, with a month-on-month increase of 0.4% instead of the expected 0.1% increase.
- US Unemployment Claims – this was slightly worse than expected.
- Canadian Unemployment Rate – this was better than expected, with the unemployment rate remaining unchanged at 6.1% due t the creation of more net new jobs than was expected.
Top Forex Brokers
The Week Ahead: 13th – 17th May
The most important item over this coming week will be the release of US CPI (inflation) data on Wednesday. Apart from that, there are several other important releases scheduled, listed in order of likely importance:
- US PPI
- US Retail Sales
- US Empire State Manufacturing Index
- US Unemployment Claims
- Australia Wage Price Index
- New Zealand Inflation Expectations
- UK Claimant Count Change
- Australia Unemployment Rate
Monthly Forecast May 2024

As May got underway, the long-term trend in the US Dollar was still unclear, so I made no monthly forecast.
Weekly Forecast 12th May 2024
Last week, I forecasted that the Japanese Yen would decline against the Euro, Pound, New Zealand Dollar, Swiss Franc, Canadian Dollar, and Australian Dollar. All of these were excellent winning trades, giving a large overall gain of 10.45%, as outlined earlier.
Directional volatility in the Forex market decreased last week, with 27% of the most important currency pairs fluctuating by more than 1% last week.
Last week, the Australian Dollar showed relative strength, and the Japanese Yen showed relative weakness.
You can trade these forecasts in a real or demo Forex brokerage account.
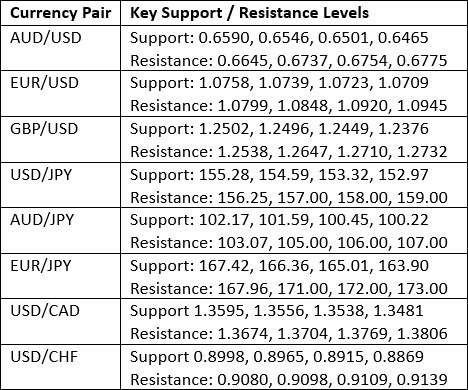
Key Support/Resistance Levels for Popular Pairs
Technical Analysis
US Dollar Index
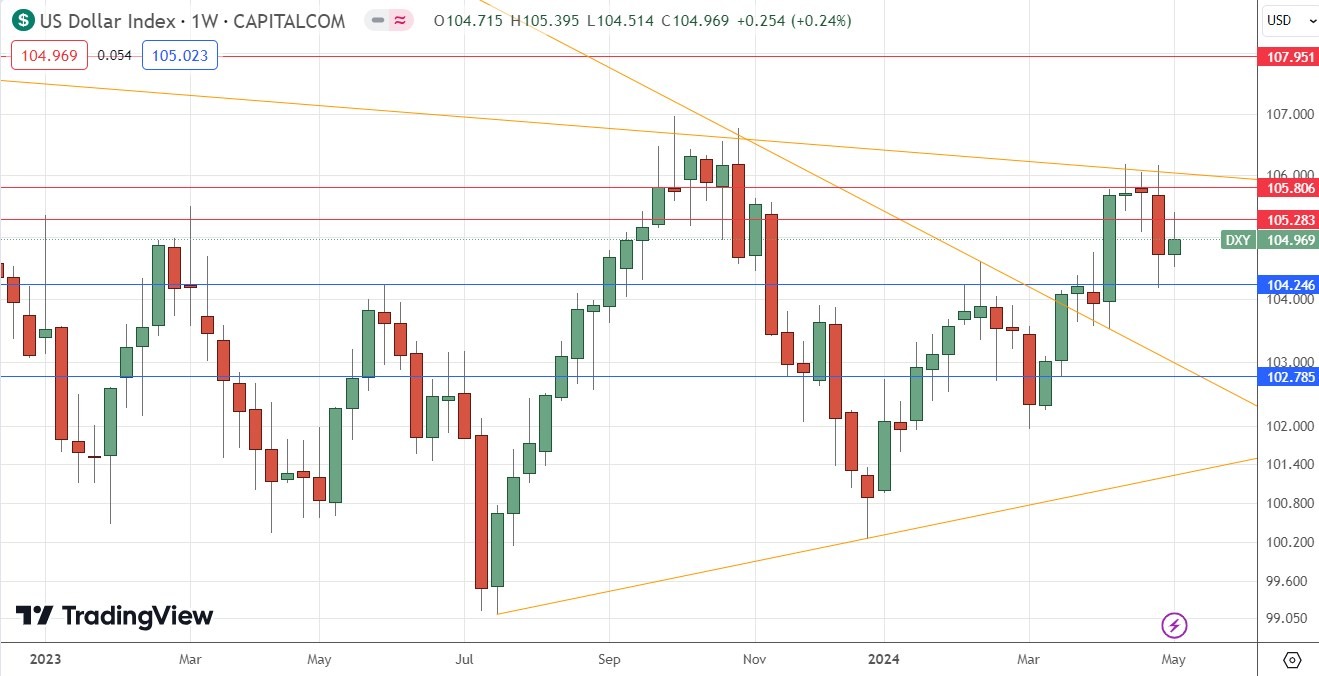
The US Dollar Index printed a small inside candlestick last week which closed slightly higher with a relatively large upper wick, signifying indecision. The candlestick is close to being a bearish pin bar. There is no true long-term trend here, as the price is above its level from 3 months ago but remains below its price of 6 months ago, making the US Dollar relatively unreliable to trade on a trend basis.
The weekly price chart below shows that the dollar has been swinging but has been in a consolidation pattern for quite a while, and the consolidation seems to be getting stronger and constricting.
However, it is worth noting that there is a confluence of a bearish descending trend line and a key horizontal resistance level at 105.81 which is not far from the current price. If the Us Dollar can get established above that level, it could be a significant bullish breakout. It could happen this week if the release of US CPI (inflation) data is notably higher than expected.
GBP/USD
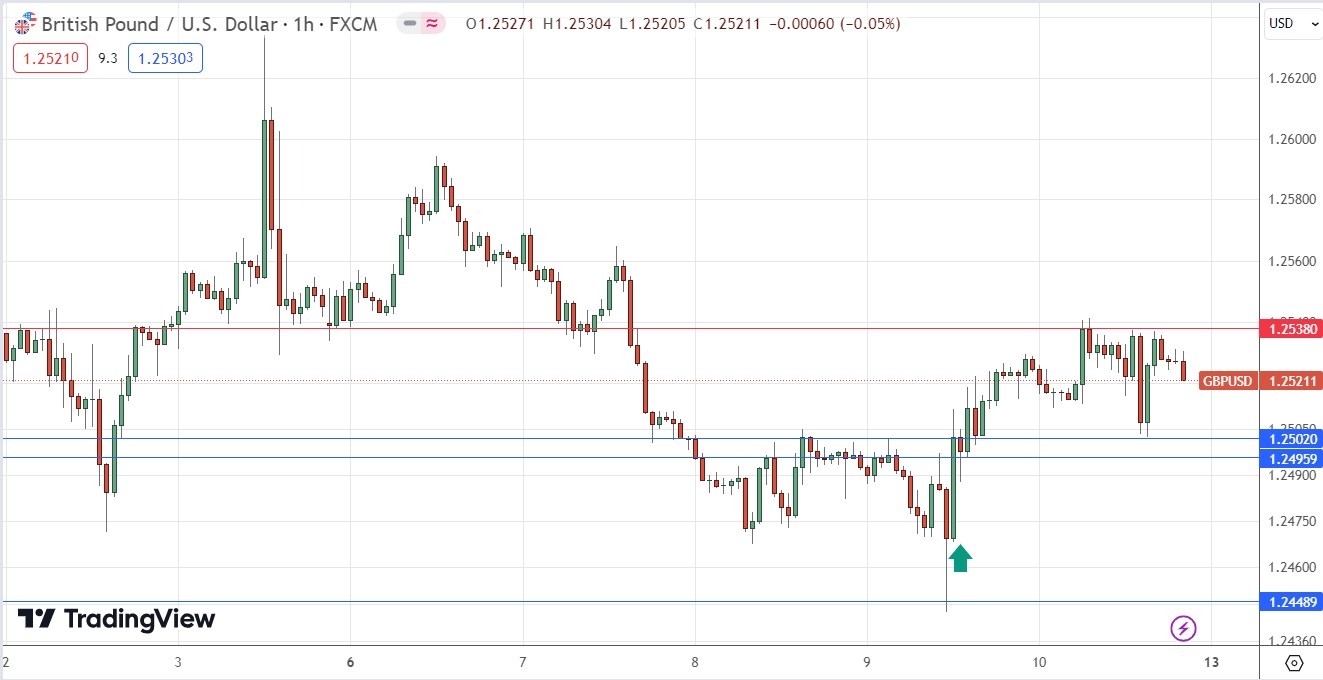
I expected that the GBP/USD currency pair would have potential support at $1.2449.
The H1 price chart below shows how this support level was rejected right at the start of last Monday’s London / New York session overlap by a bullish doji, marked by the up arrow in the price chart below, signaling the timing of this bullish rejection. This was then followed by an inside candlestick, which broke bullishly during the next time period. This can be an excellent time of day to enter a trade in a currency pair which involves the US Dollar such as this one.
This trade has been somewhat profitable, with the maximum reward-to-risk ratio reached so far depending greatly upon the positioning of the stop loss. If only the inside candlestick was used for the stop, the trade would have had an OK ratio.
USD/JPY
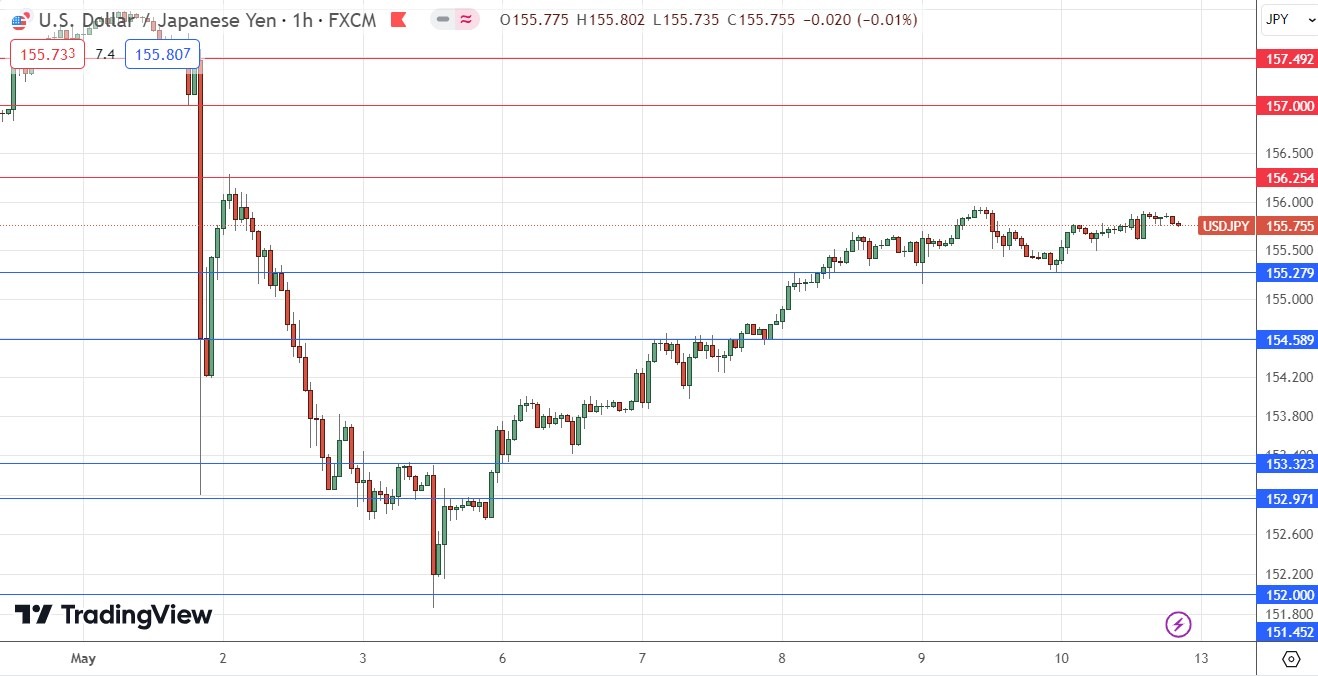
The USD/JPY currency pair was active this week, as were all the Yen crosses. This is due to volatility remaining within the Japanese Yen after its recent massive price movements, with the volatility goosed by two suspected interventions from the Bank of Japan.
The Yen is weakening everywhere, and so of course it also weakened against the US Dollar. However, several other currencies gained even more against the Yen last week.
Technically we see the bullish momentum starting to evaporate into a consolidation below ¥156.00.
Yen weakness is quite likely to persist over the coming week. Whether this is the best pair to use to be short of the Yen is debatable. However, if the Yen does stay weak, long trades from bounces at support levels in this currency pair are likely to be good trades.
Gold
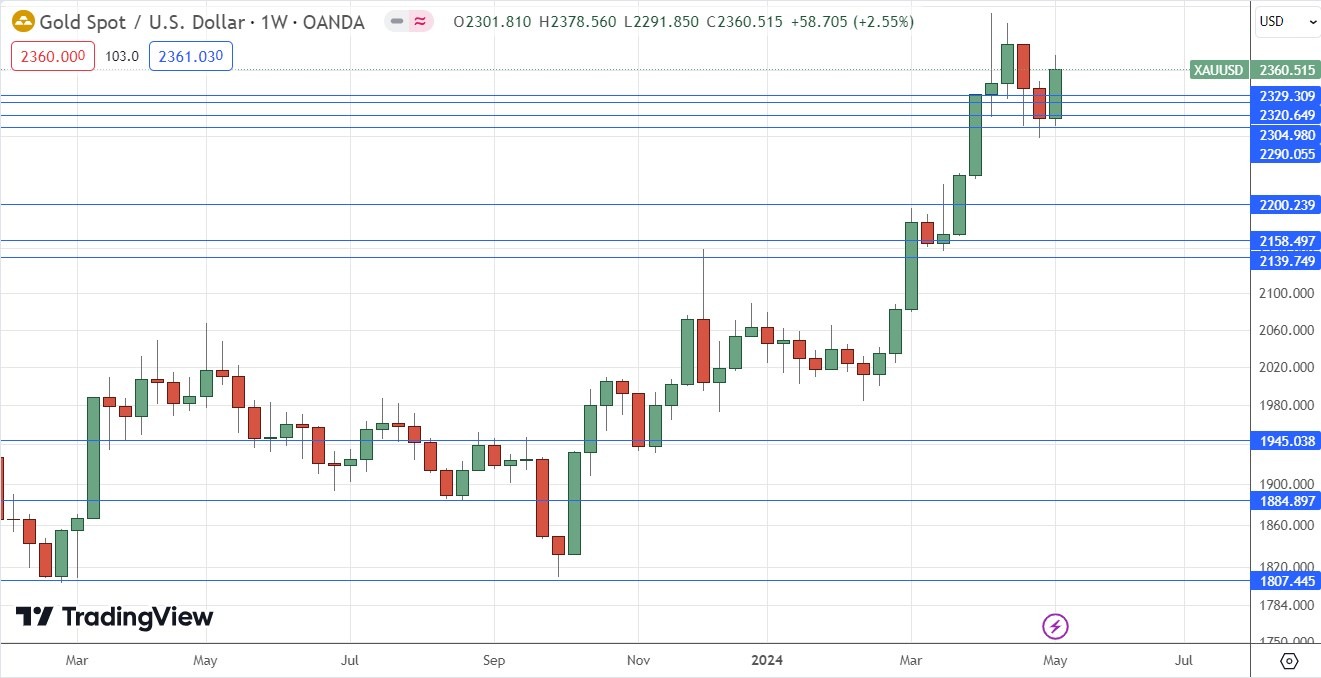
The price of Gold rose quite firmly last week, printing a bullish engulfing candlestick of good size, although Friday saw Gold give up some of its gains through a short-term topping out. The weekly price chart below shows some upper wick on the weekly candlestick. However, the price closed notably higher, and is not very far from making a record high weekly close, which was last made 4 weeks ago at $2392.
We do not yet have bullish breakout conditions, but long trades do look more likely to succeed than short ones, and there is certainly a long-term bullish trend here.
I think we could see a good point to enter a new long trade if we get either:
- A daily close above $2400, or
- A retracement to any of the support levels above $2290.
Silver
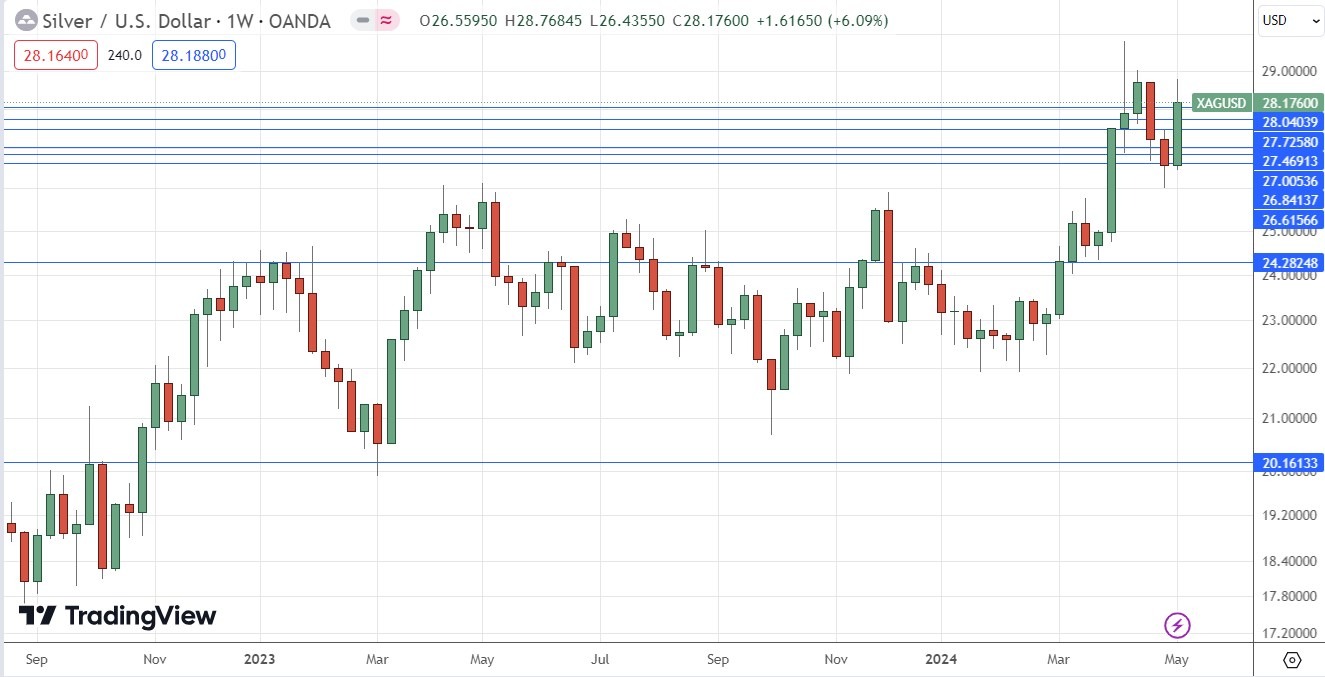
The price of Silver rose quite firmly last week, printing a bullish engulfing candlestick of good size, although Friday saw Silver give up some of its gains. The weekly price chart below shows some upper wick on the weekly candlestick. However, the price closed notably higher, and is not very far from making a record multi-year high weekly close, which was last made 4 weeks ago at $28.69.
We do not yet have bullish breakout conditions, but long trades do look more likely to succeed than short ones, and there is certainly a long-term bullish trend here.
I think we could see a good point to enter a new long trade if we get either:
- A daily close above $29, or
- A retracement to either of the support levels at $27.72 or $27.46, with $27.46 looking especially strong due to its confluence with $27.50.
S&P 500 Index
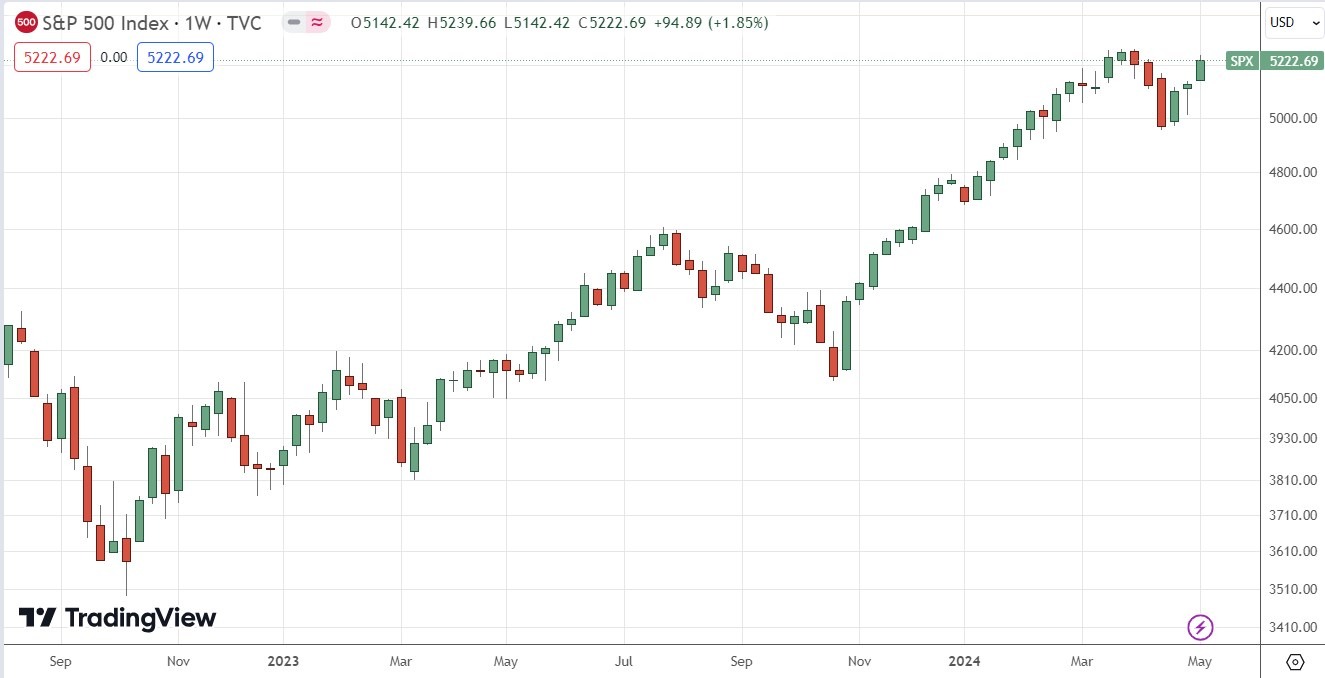
After major US equity indices dropped quite sharply 4 weeks ago after making new all-time highs, US stock markets have been rising slowly but surely, and last week saw quite good performances, especially here in the broad, benchmark S&P 500 Index. It is worth noting that this Index outperformed the NASDAQ 100 Index, which is unusual in a bear market and suggests that the tech sector currently has some vulnerability.
The weekly price chart below shows a bullish candlestick that closed quite near its high. There was some upper wick, but nothing unduly large for bulls to worry about.
There is clearly a long-term bullish trend coupled with mostly bullish short-term momentum. The issue for bulls here is likely to be that the price is near the recent record highs which could provide resistance and trigger another bearish reversal if reached.
For this reason, I will only consider entering a new long trade here if we see a new record high daily close. I prefer a daily close above 5265 which would be a new record high.
We have seen renewed risk-on sentiment in recent days, which is benefiting stocks and precious metals. Gold and silver are positively correlated with stock market performances historically.
Bottom Line
I see the best trading opportunities this week as follows:
- Long of the S&P 500 Index following a daily close above 5265.
- Long of Gold following a daily close above $2400.
- Long of Silver following a daily close above $29.00.
Ready to trade our weekly Forex analysis? We’ve made a list of the best brokers to trade Forex worth using.
