Fundamental Analysis & Market Sentiment
I wrote on 12th May that the best trade opportunities for the week were likely to be:
- Long of the S&P 500 Index following a daily close above 5265. This set up at close on Wednesday and produced a loss of 0.02%.
- Long of Gold following a daily close above $2400. This did not set up until the end of the week.
- Long of Silver following a daily close above $29.00. This set up on Wednesday and produced a win of 6.16%.
The overall result was a net win of 6.14%, resulting in a win of 2.05% per asset.
Last week’s key takeaway was the strong resumption of risk-on sentiment due to lower-than-expected US CPI (inflation), which fell from 3.5% annualized to 3.4% as expected. The dovish surprise was in the monthly increase, which was only 0.3% and not the 0.4% which was expected.
It is worth noting that markets were beginning to become weakly risk-on earlier in the week before this data release, which suggests an underlying bullishness in stock markets, perhaps driven by stronger than expected corporate earnings in the USA seen over recent weeks. Anyway, the lower US inflation data sent major indices rising to new highs. This is not only happening in the USA, but also to several major global equity indices. The MSCI World Index reached a new record high last week.
There were two other highly important US data releases last week. PPI came in notably higher than expected, with markets expecting a monthly increase of 0.3% but getting 0.5%. This stoked fears on Tuesday that the CPI data the following data would be high, which turned out not to be true. Retail Sales data showed no increase at all over the past month, which boosted the effect of the lower CPI data in raising the chance of an earlier rate hike.
According to the CME FedWatch tool, about 68% expect the first rate cut to happen at the Fed’s September meeting.
Other important data releases last week were:
- US Empire State Manufacturing Index – about as expected.
- US Unemployment Claims – about as expected.
- Australia Wage Price Index – just a fraction lower than expected, which is very slightly dovish for inflation and rates.
- New Zealand Inflation Expectations – fell from 2.50% to 2.33%, which is dovish.
- UK Claimant Count Change – slightly better than expected.
- Australia Unemployment Rate – rose unexpectedly from 4.1% to 3.9% which may be slightly dovish for inflation and rates.
Top Forex Brokers
The Week Ahead: 20th – 24th May
The most important item over this coming week will be the release of US FOMC Meeting Minutes on Wednesday. Apart from that, there are several other important releases scheduled, listed in order of likely importance:
- UK CPI
- Reserve Bank of New Zealand Official Cash Rate and Monetary Policy Statement
- Canadian CPI
- US Revised UoM Consumer Sentiment
- UK Retail Sales
- Flash Services / Manufacturing PMI in USA, Germany, UK, and France
- US Unemployment Claims
Monthly Forecast May 2024
As May got underway, the long-term trend in the US Dollar was still unclear, so I made no monthly forecast.
Weekly Forecast 19th May 2024
Last week, I made no weekly forecast, as there were np unusually large swings in any Forex currency crosses, which is the basis of my weekly trading strategy.
Directional volatility in the Forex market remained more or less the same last week, with 30% of the most important currency pairs fluctuating by more than 1%.
Last week, the New Zealand Dollar showed relative strength, and the Swiss Franc showed relative weakness.
You can trade these forecasts in a real or demo Forex brokerage account.
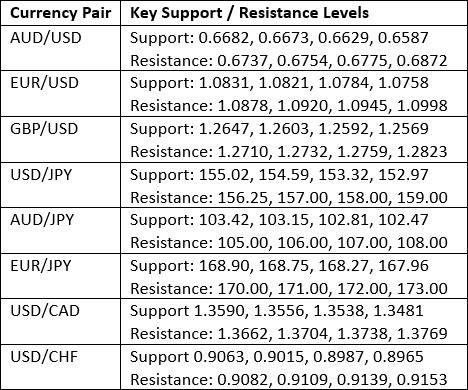
Key Support/Resistance Levels for Popular Pairs
Technical Analysis
US Dollar Index
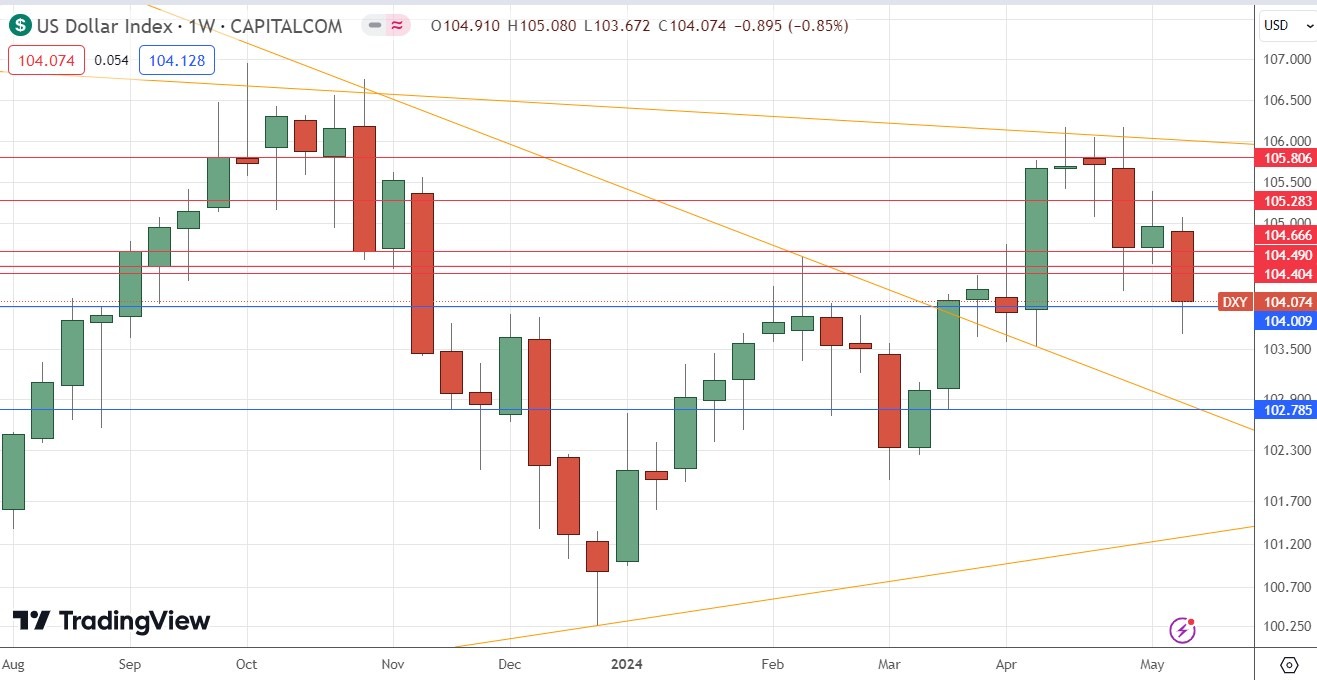
The US Dollar Index printed a fairly large bearish engulfing candlestick last week which closed firmly lower. Despite the firm downwards move over the week, it is worth noting that the support level at 104.00 held. There is also a bullish long-term trend as the price is now above its levels from 3 months ago and its price of 6 months ago.
The weekly price chart below shows that the dollar has been swinging but has been in a consolidation pattern for quite a while, and the consolidation seems to be getting stronger and constricting.
A useful approach might be to see whether the support at 104.00 holds here as the new week begins. The longer the price remains trading above this level, the more likely it is that the Dollar will start to make a meaningful recovery. Below 104.00, that looks much less likely.
GBP/JPY
The GBP/JPY currency cross rose strongly during the week, despite taking a large dip midweek. The price recovered to end the week quite near its high, which is a bullish sign.
There is weakness in the Japanese Yen which, apart from the weaker US Dollar, is the major defining feature of the Forex market right now. Conversely, the British Pound is showing long-term strength, which makes a strong case to use this cross now if you want to be short of the Yen.
When trading this cross, it helps to check support and resistance levels in the USD/JPY and GBP/USD currency pairs to be sure the price can rise or fall relatively easier.
I think a long trade at either a firm breakout beyond last week’s high, or a bullish bounce following a retracement to ¥197.26, could be good signals for a long trade entry.
USD/ZAR
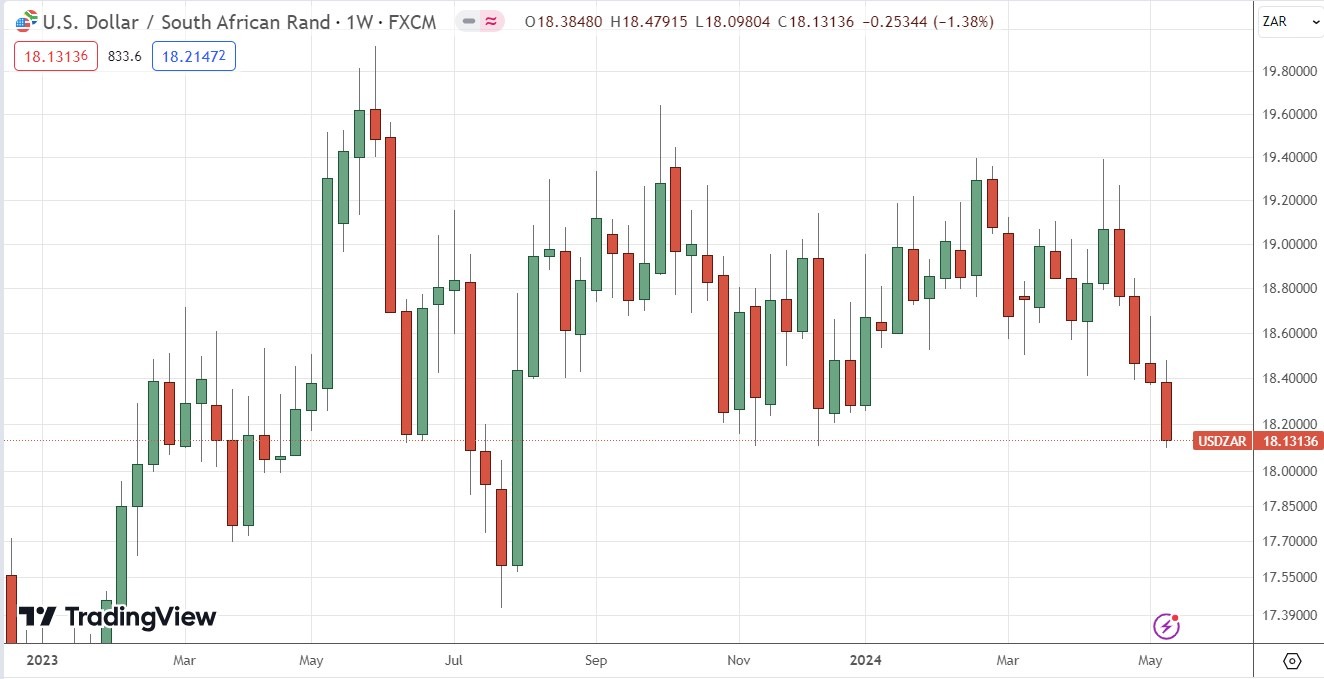
The USD/ZAR currency pair fell strongly last week, closing very near the low of its range, and making its lowest weekly close in 9 months. These are bearish signs, but bears should note that the lows of autumn 2023 have not been properly broken yet and might still produce some support for the price.
There is short-term bearish momentum, and this is more about the strength of the South African Rand than the weakness of the US Dollar, although the US Dollar did sell off last week. The Rand has been boosted by improving business confidence and orders metrics in South Africa. The general election which will be held on 29th May, barely more than one week away, is producing some questionable promises, but the economic picture does seem to be improving somewhat. Polls suggest that the ANC, which has ruled since democracy began in 1994, is in serious danger of losing control for the first time. This is probably also helping to strengthen the Rand, as the ANC’s rhetoric has moved to the left.
Gold
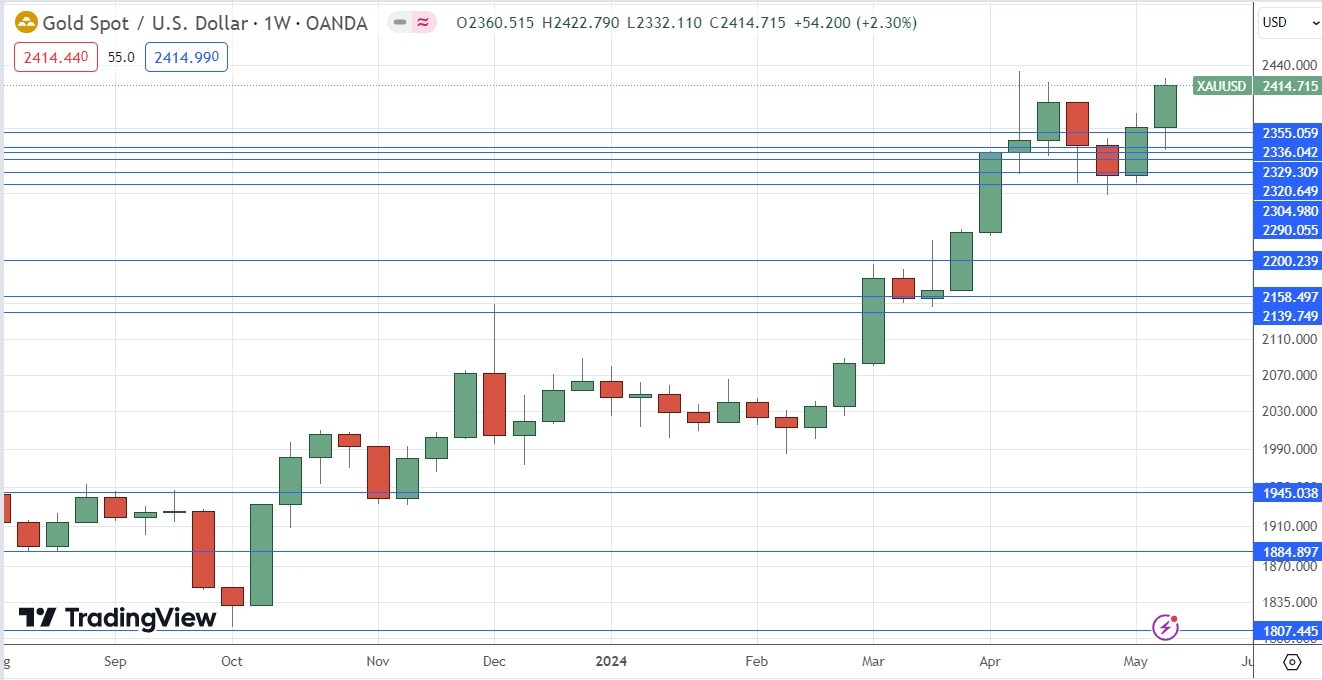
The price of Gold rose strongly last week, printing a bullish candlestick which closed near its high. It is worth noting that the price did not make a new high, although the weekly close was a record high.
Overall, we see bullish signs, but the price is not trading in “blue sky”. Note also that Silver outperformed Gold last week and has looked more bullish than Gold for a while longer than that.
Another bullish factor for Gold is the strength in major stock markets, many of which are rising to new record highs. Gold, contrary to widespread belief, is positively correlated with stock markets.
I think Gold looks like a buy right now, although more conservative traders might want to see a New York close above the record high at $2431 before entering.
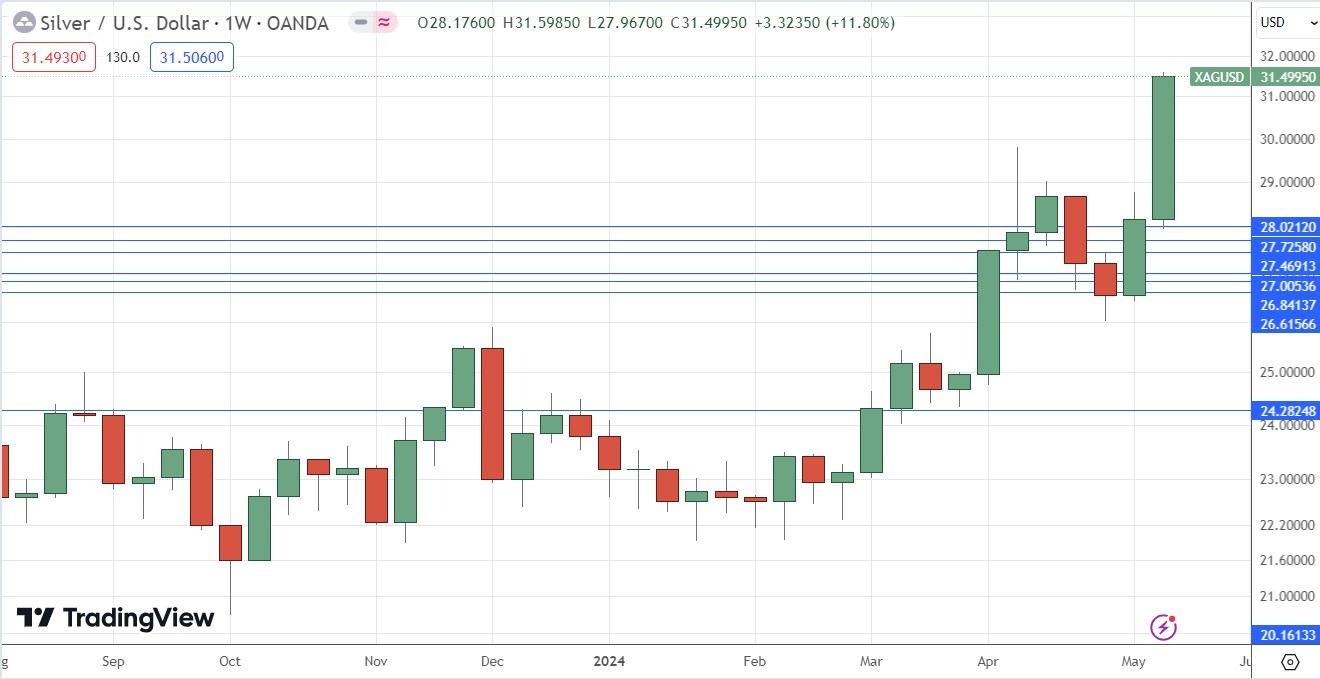
Silver
The price of Silver rose very strongly last week, printing the largest bullish candlestick seen in years. The candlestick closed very near the high of its range, which is a bullish sign. There is no doubt there is strong bullish momentum here, but over the long and short term.
Silver is trading in blue sky now at a new 11-year high price, well above the major round number at $30.
Another bullish factor for Silver is the strength in major stock markets, many of which are rising to new record highs. Gold, contrary to widespread belief, is positively correlated with stock markets.
I think Silver looks like a strong buy immediately.
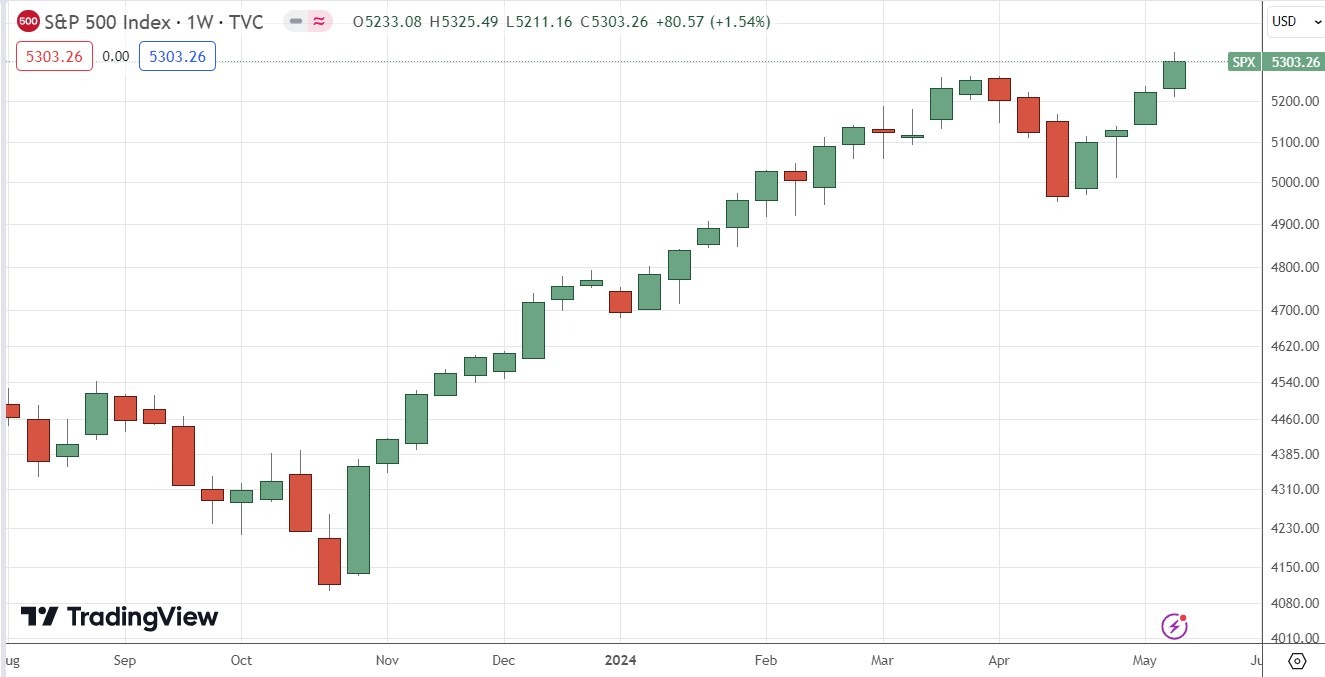
S&P 500 Index
After making a fairly deep bearish retracement in April following new all-time highs, the S&P 500 Index rose again last week to again break into new record territory.
There is a small upper wick, but the key things to note are that the weekly close was above the previous record high, and that the wick is nothing out of the ordinary.
It makes sense to be bullish on this major stock market index when it is rising firmly to make new record highs. Historic precedent shows this tends to produce further gains quickly.
It is worth noting that this index is outperforming the NASDAQ 100 Index, suggesting a broad market rally driven by higher than expected earnings outside the tech sector.
I see the S&P 500 Index as a buy.
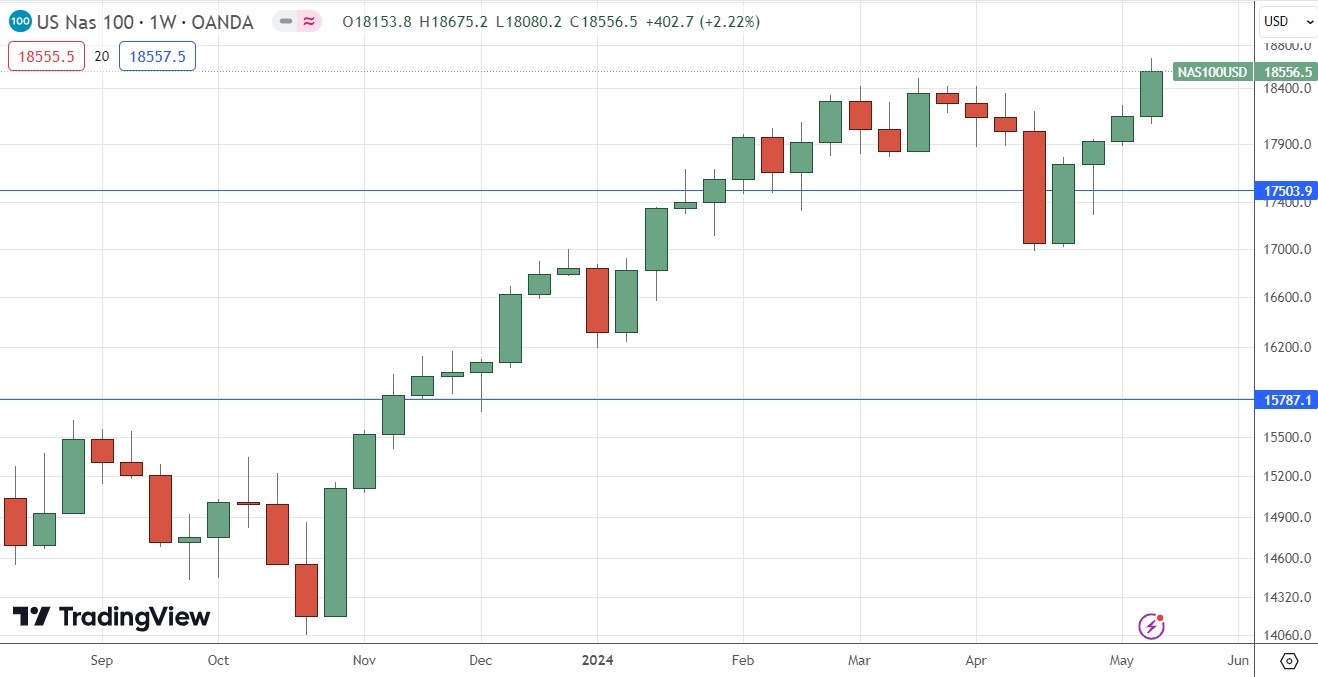
NASDAQ 100 Index
After making a fairly deep bearish retracement in April following new all-time highs, the NASDAQ 100 Index rose again last week to again break into new record territory.
There is a small upper wick, but the key things to note are that the weekly close was above the previous record high, and that the wick is nothing out of the ordinary.
It makes sense to be bullish on this major stock market index when it is rising firmly to make new record highs. Historic precedent shows this tends to produce further gains quickly.
However, it is worth noting that this index is underperforming the broader S&P 500 Index, suggesting that the performance here could be relatively weak as it is more of a wide market rally than a tech-driven one.
I therefore see the NASDAQ 100 Index as a buy, but only after a daily close above the record high at 18613.
Bottom Line
I see the best trading opportunities this week as follows:
- Long of the S&P 500 Index.
- Long of the NASDAQ 100 Index following a daily close above 18613.
- Long of Gold.
- Long of Silver.
Ready to trade my weekly Forex forecast? Here are the best Forex brokers to choose from.


