Fundamental Analysis & Market Sentiment
I wrote on 15th September that the best trade opportunities for the week were likely to be:
- Short of the USD/JPY currency pair following a daily close below ¥140. This did not set up.
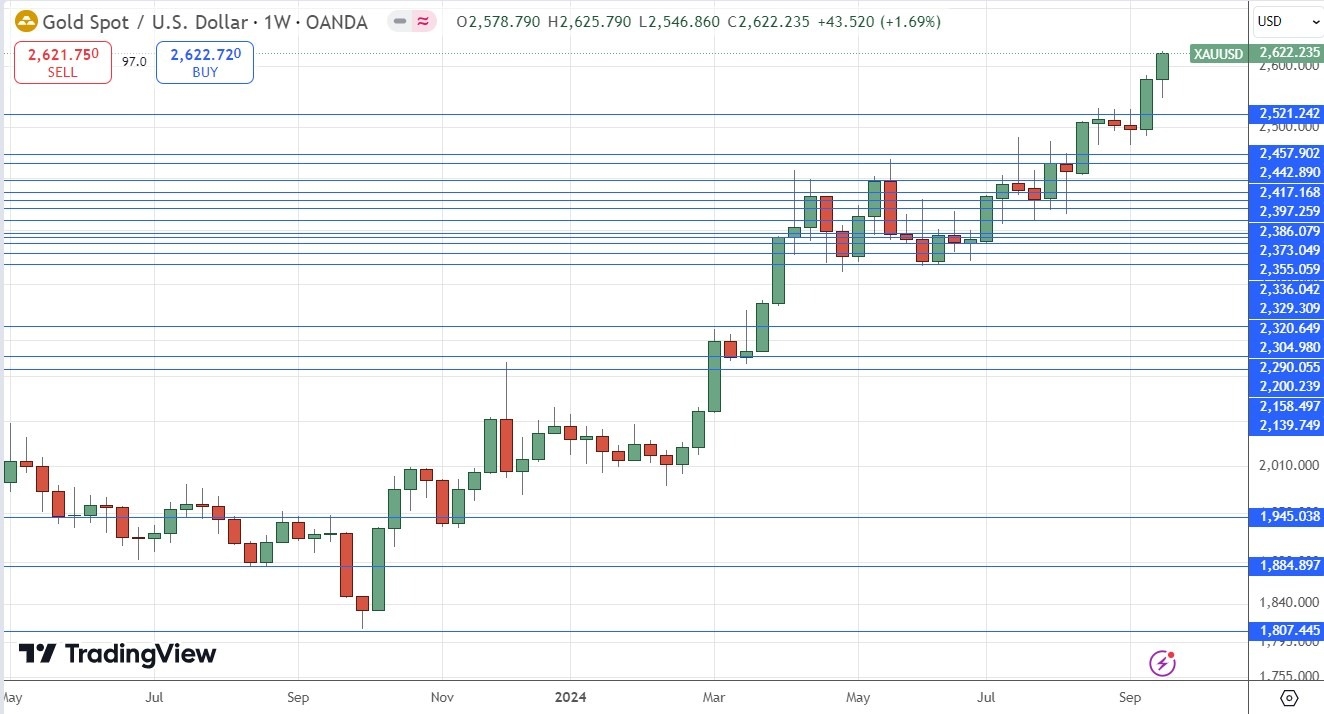
- Long of Gold in USD terms. The price of Gold rose over the week, producing a win of 1.68%.
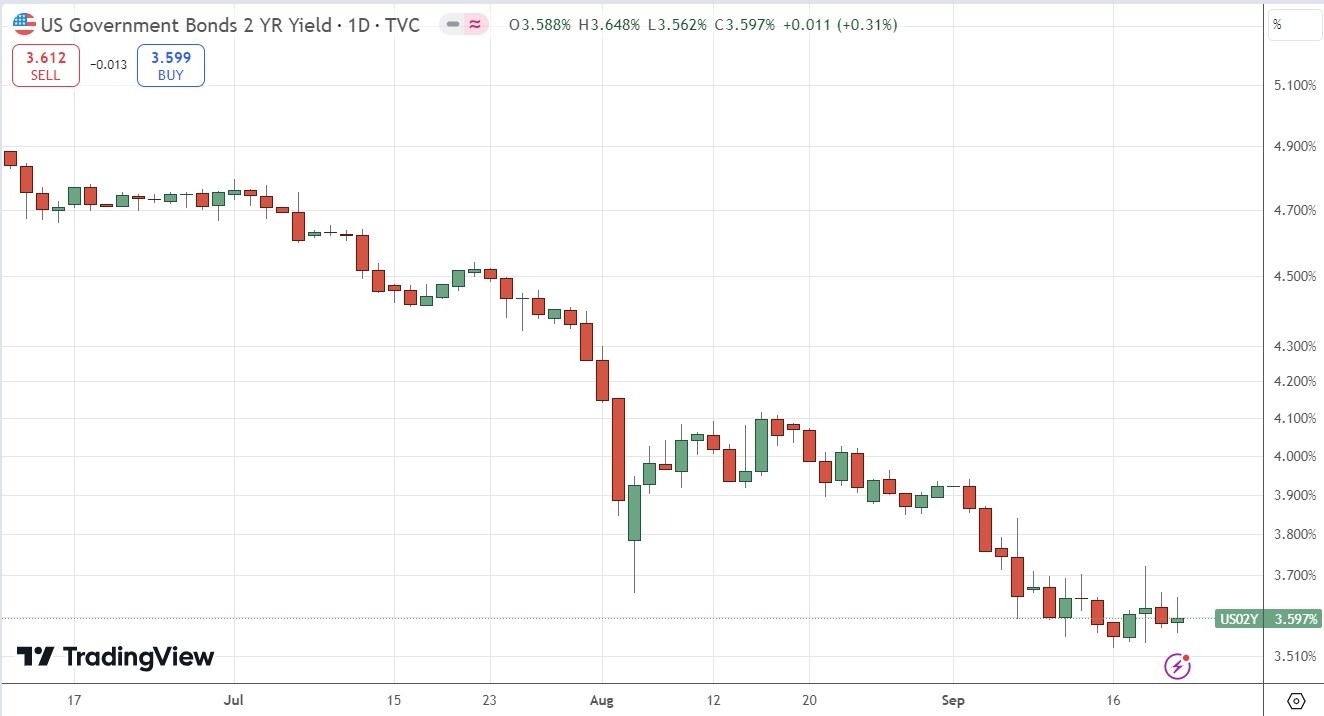
- Short of the 2-Year US Treasury Yield. This rose over the week, producing a loss of 0.25%.
Top Forex Brokers
Overall, these trade opportunities produced a win of 1.43%, averaging 0.48% per asset.
Last week’s key takeaways were:
- US Federal Funds Rate / Economic Projections / FOMC Statement – the Fed cut rates by 0.50% and signalled further cuts totalling an additional 0.50% before the end of 2024. This was the more dovish option, although most analysts expected it.
- Bank of Japan Policy Rate and Monetary Policy Statement: The Bank of Japan left its interest rate unchanged and made a statement promising continued normalization of rates.
- UK Official Bank Rate and Monetary Policy Summary: The Bank left rates unchanged as expected, but its decision and statement were a bit more hawkish than expected, which helped boost the British Pound to reach fresh long-term highs last week.
- UK CPI (inflation) came in as expected at an annualized rate of 2.2%.
- Canadian CPI—The overall CPI was lower than expected, showing a month-on-month fall of 0.2%, while no change was anticipated, but the median CPI edged a fraction higher.
- US Retail Sales—This was stronger than expected, showing a monthly increase of 0.1% when it was expected to fall by 0.2%.
- US Unemployment Claims – this came in more or less as expected.
- UK Retail Sales—This was much stronger than expected, with a monthly increase of 1.0%, when an increase of only 0.3% was anticipated.
- Canada Retail Sales—This was much stronger than expected, with a monthly increase of 0.9% when an increase of only 0.5% was anticipated.
- New Zealand GDP—This was a bit better than expected, as the monthly decline of 0.4%, which was widely expected, was bettered by the actual decline of only 0.2%.
- Australian Unemployment Rate – this was unchanged as expected at 4.2%.
The Week Ahead: 22nd – 26th September
It will be a slower week ahead in terms of high-impact data, although it includes two central bank policy releases:
- US Core PCE Price Index
- US Final GDP
- US CB Consumer Confidence
- US, Germany, UK, France Flash Manufacturing & Services PMI
- RBA Cash Rate & Rate Statement
- Australian CPI (inflation)
- SNB Policy Rate and Monetary Policy Assessment
- US Unemployment Claims
- Canadian GDP
- Minor speeches from the Chair of the Federal Reserve, the Bank of Japan, and the Bank of Canada.
Monthly Forecast September 2024
I forecasted that the EUR/USD currency pair would rise in value during September. The performance of my forecast so far is as follows:
Weekly Forecast 22nd September 2024
Last week, I made no weekly forecast, as there was no large group of currency crosses with unusually large directional movement, which is the basis of my weekly trading strategy.
This week, I again do not give a weekly forecast, as although six important currency crosses showed unusually large price fluctuations, the odds are better when there are seven. It is probably technically likely that the Japanese Yen will make some gain over the coming week after being sold so strongly last week on improving risk sentiment.
Directional volatility in the Forex market rose last week—44% of the most important currency pairs and crosses fluctuated by more than 1%.
Last week, the Australian Dollar was the strongest major currency, while the Japanese Yen was the weakest.
You can trade these forecasts in a real or demo Forex brokerage account.
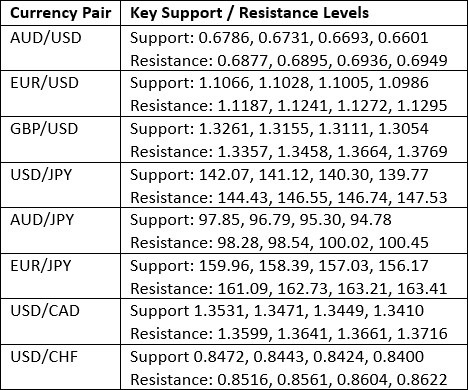
Key Support/Resistance Levels for Popular Pairs
Technical Analysis
US Dollar Index
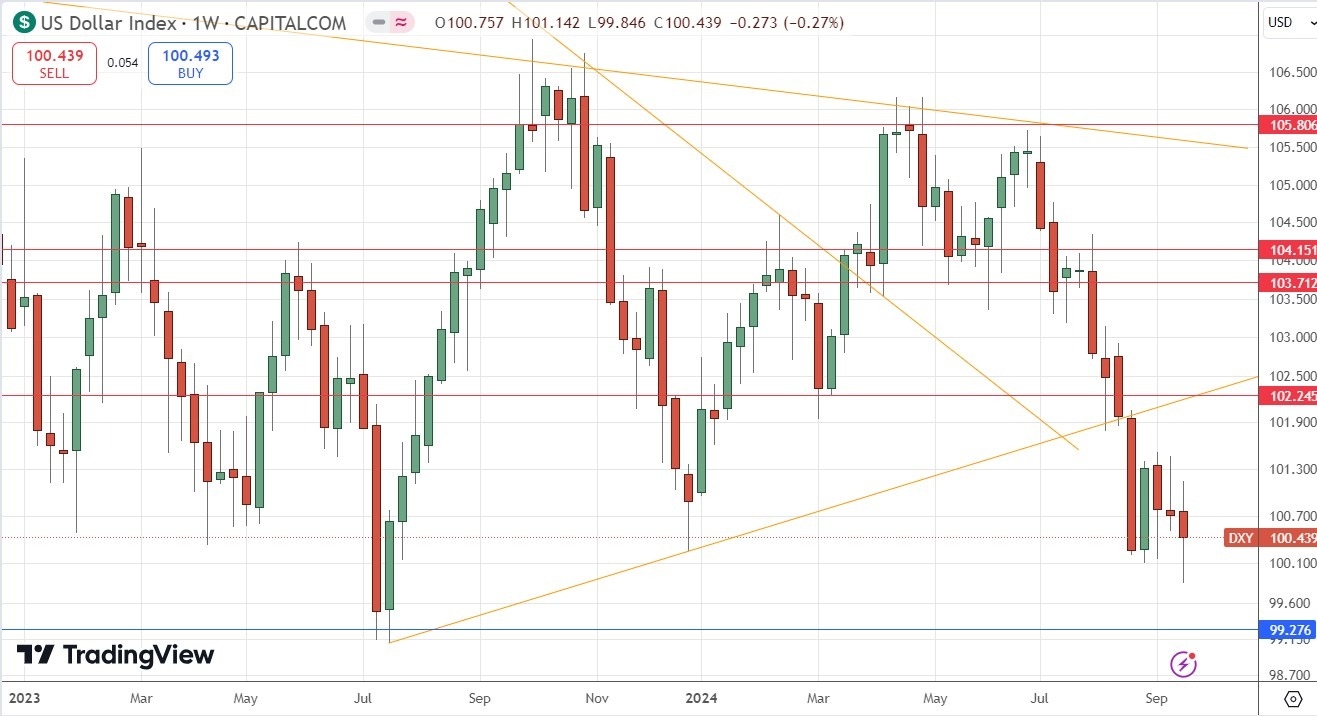
Last week, the US Dollar Index printed a bearish candlestick, although the price closed quite high up within its range after printing a large lower wick, signifying indecision as it was near the halfway point of the week’s price range. The price is below its levels three and six months ago, suggesting a long-term bearish trend in the greenback, which is a bearish indication. Recently, the price broke below the long-term consolidating triangle pattern, which was also a significant bearish sign.
The overall picture is bearish but weakly so. If the long-term low at the support level shown in the price chart is reached, we could see a strong bullish reversal from that area.
This week, I am cautiously bearish on the US Dollar due to the bearish trend and price action.
GBP/USD
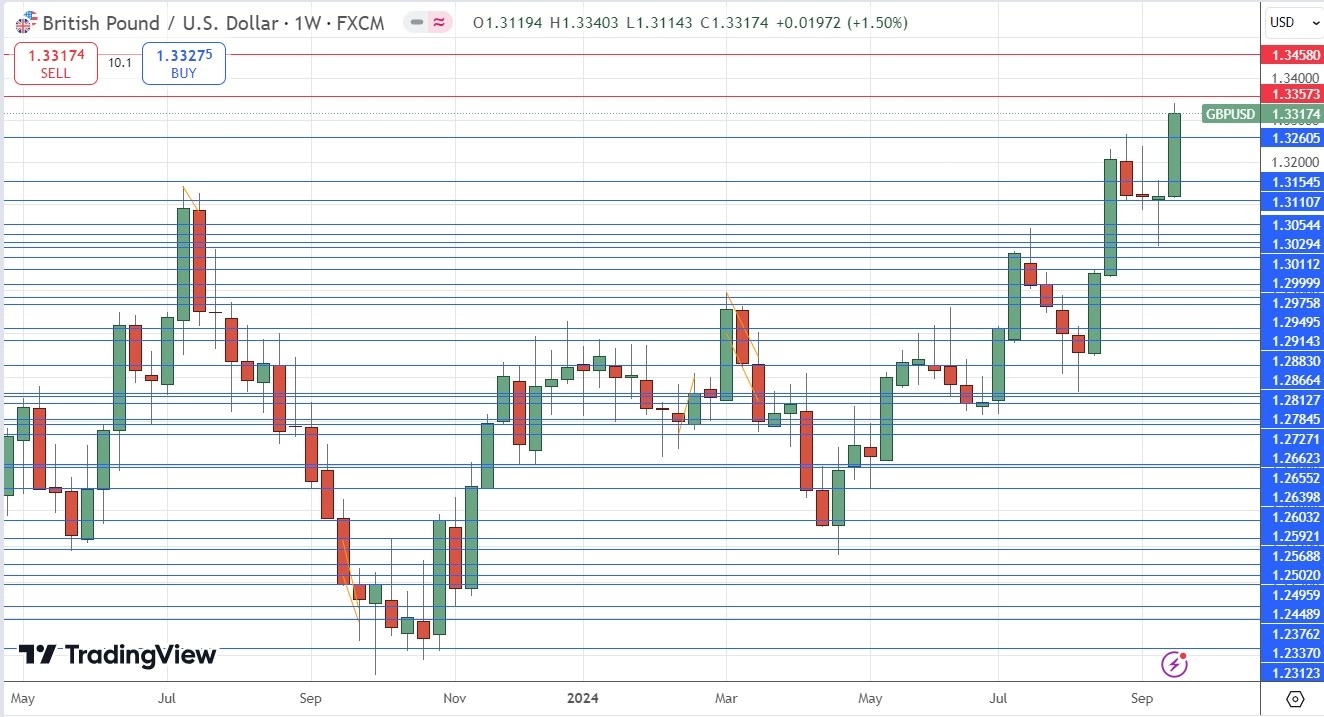
The GBP/USD currency pair rose strongly last week after the Bank of England voted slightly more strongly than expected to hold its interest rate at 5.00%, well above the unchanged inflation rate of 2.2%. This puts it on a somewhat divergent path to the Federal Reserve, allowing the Pound to take off towards the end of last week.
The weekly chart below shows how the price rose strongly to close at a new 2.5-year high. The closing price was near the high of the week, which is another bullish sign.
This currency pair is a buy with the US Dollar in a bearish trend. Keep in mind that this currency pair is suited to tight stop losses when its momentum or trend is traded, as I am doing now on the long side.
USD/JPY
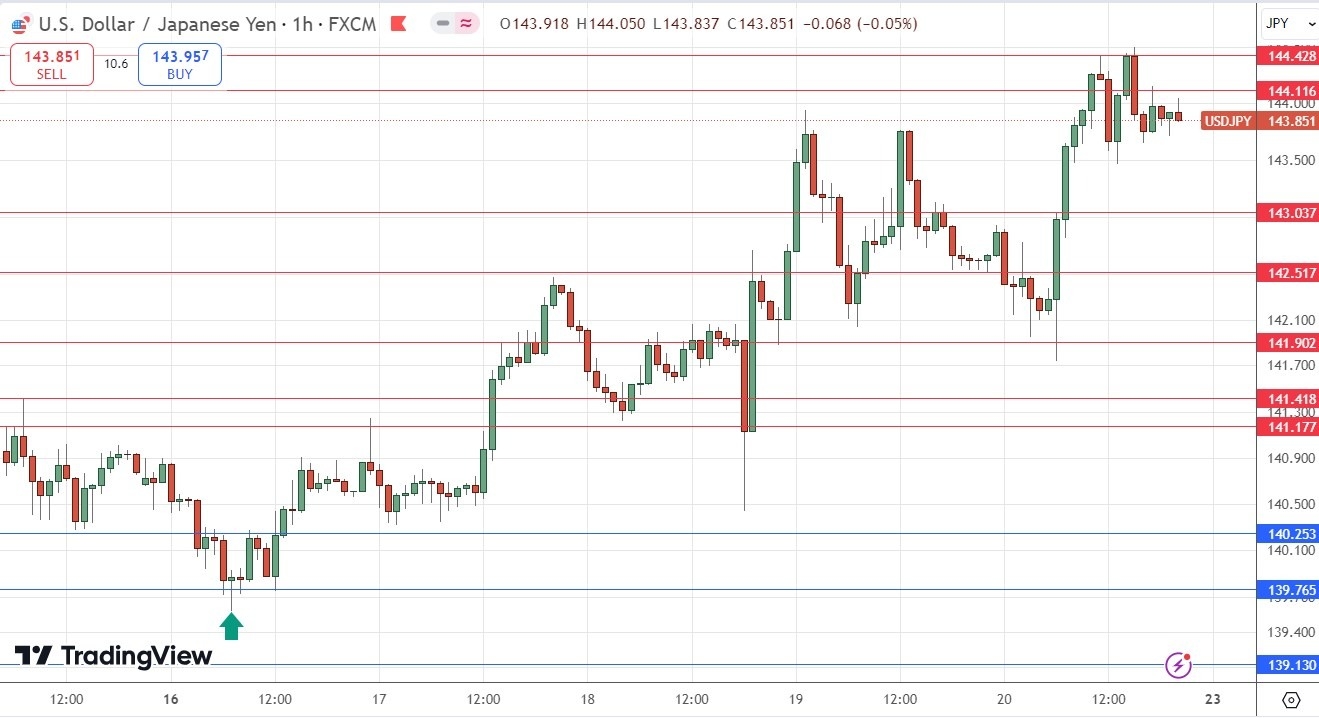
I expected the USD/JPY currency pair to have potential support at ¥139.77.
The H1 price chart below shows how the price action rejected this support level with a pin bar, marked by the up arrow within the price chart below. This rejection occurred during the overlap of the London / Tokyo sessions, which can often be a great time for reversals like these in the Japanese Yen.
This trade made an excellent maximum profit of approximately 11 to 1 so far.
This pair was in a valid long-term bearish trend, but above ¥145, almost everyone will give up on it. Many will have done so already.
We are seeing a weakening in the Japanese Yen, which is due mostly to a resurgence in risk-on sentiment. The Yen attracts a lot of haven flow. Analysts had also seen the Yen strengthening on the belief that the Bank of Japan would hike rates further, but the Bank took no such action at its policy meeting last week, so the prospect of rate hikes isn't impressing the market right now.
XAU/USD
Last week, I wrote that Gold was advancing strongly into blue sky, making new record high prices. This was a good call, as the price rose even further over the past week. The price closed right on the high of its weekly range, which is another bullish sign. The price is also beyond major round numbers like $2,500 and $2,600, so it should have room to rise technically.
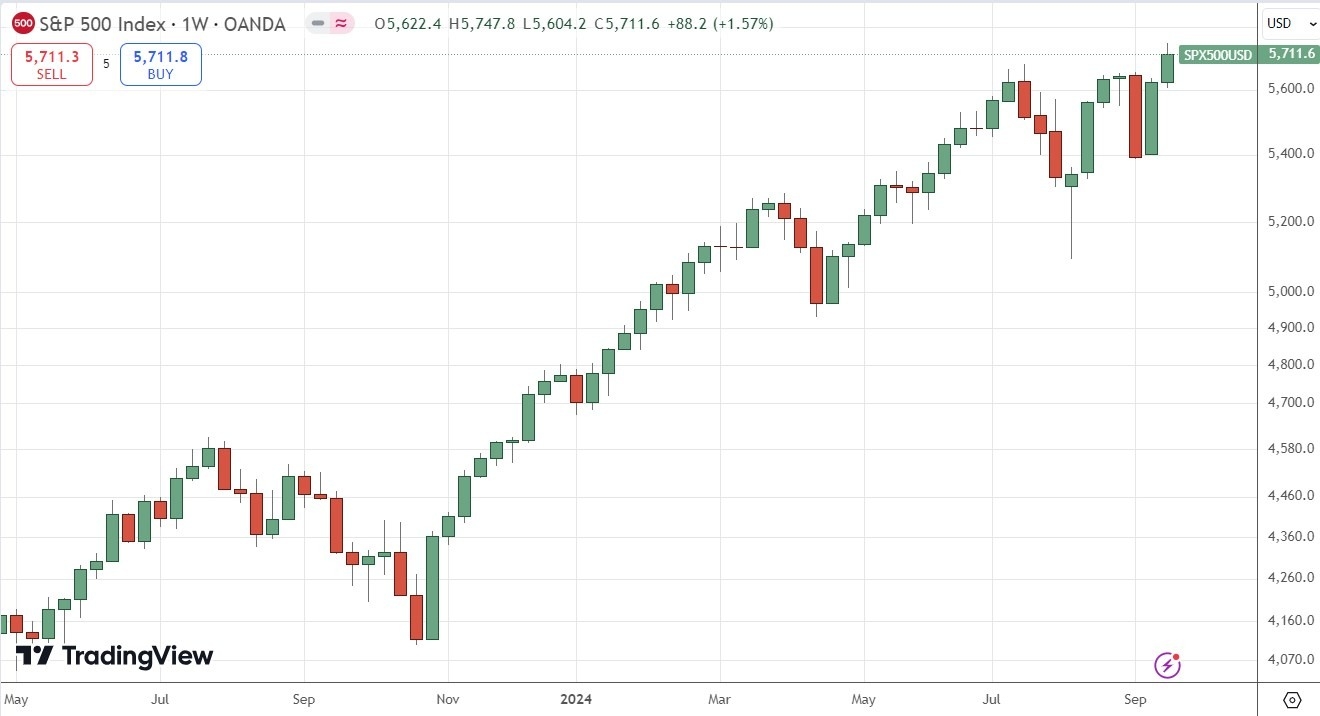
It is hard to say exactly why Gold is advancing to new record highs. I am never convinced that Gold has a special function. It tends to operate as a risk-on asset and has historically been positively correlated with major equity indices. Of course, the S&P 500 Index reached a new record high last week.
I see Gold as a buy, without any doubt.
S&P 500 Index
Stock markets, especially in the USA, were on a strong bullish run to new highs earlier this year, with technology stocks making particularly strong gains. The past two months saw a deep bearish retracement by the S&P 500 Index followed by a consolidation, but at the end of last week, we finally got a breakout to a new record high. The weekly close on Friday was at a record high, but the weekly candlestick does have a small yet notable upper wick.
This bullish breakout is a bullish sign, and it is always worth it for trend traders to go long of major equity indices at breakouts to new record high prices. When this happens, there is usually a strong advance over the past year. However, the bearish case will say that we have already seen strong gains in this equity index over the past year or so, meaning there might not be much more to run for a while.
Another factor here is the upcoming US Presidential election. The victory of a new President typically triggers a boom in the US stock market, and whatever happens, we will get a “new” President.
I see the S&P 500 Index as a buy.
USD/CAD
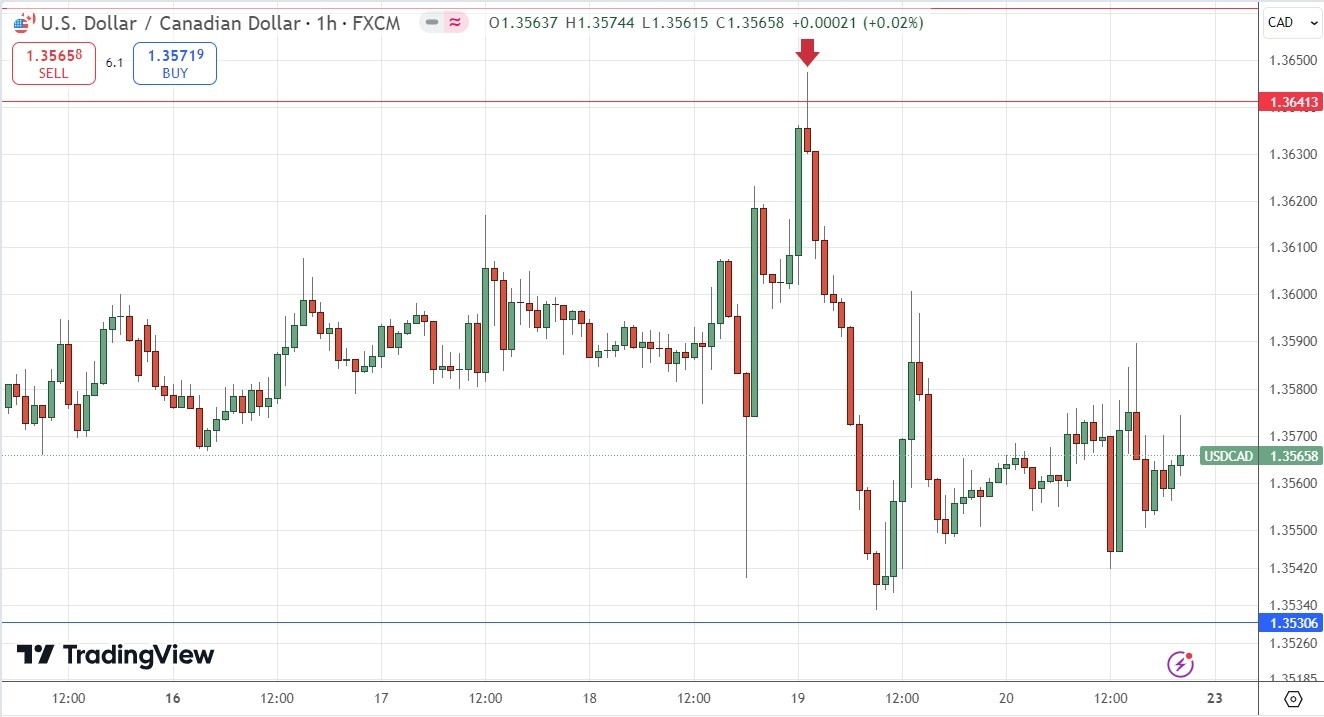
I expected the USD/CAD currency pair to have potential support at $1.3641.
The H1 price chart below shows how the price action rejected this support level with a pin bar, marked by the down arrow within the price chart below.
This trade made a good maximum profit of almost 5 to 1 so far.
The US Dollar has been consolidated between $1.3175 and $1.3950 for about two years. As such, reversals near these extremes will probably be good trade entries. These are convergent, highly interconnected economies, so consolidation is a natural state of affairs here.
US 2-Year Treasury Yield
Some CFD brokers offer trading in US Treasury Yields, and traders with larger bankrolls can access this asset through the CME micro futures market. Treasury yields can be great for trend traders as they have historically tended to trend very reliably.
The Fed delivered a bearish policy last week, which was expected but had been in some doubt. Nevertheless, although many assets saw logically dovish price movement, the 2-Year Yield did not fall to a new low, which I thought was significant. This suggests that the market really doesn’t see a fair price below 3.50%.
I am in a short trend trade here, which is logical, but I increasingly expect that my trailing stop will be hit fairly soon.
Despite my pessimism about my short trade, the daily price chart below shows bearish price action, which is starting to look a little heavy. This suggests that a breakdown below 3.50% remains possible.
As I like to follow the price and not my fears in trading, it will make sense to enter a short trade if we get a daily close below 3.55%.
Bottom Line
I see the best trading opportunities this week as:
- Long of Gold in USD terms.
- Long of the S&P 500 Index.
- Short of the 2-Year US Treasury Yield following a daily close below 3.55%.
Ready to trade our weekly Forex forecast? We’ve listed the top Forex brokers worth checking out.


