Price movements in Forex markets are usually determined mostly by supply and demand concerning the larger global currencies, primarily the U.S. Dollar and to a lesser extent the Japanese Yen, the Euro, the British Pound, etc. Conditions of supply and demand in these currencies are usually determined in turn by momentum, major support and resistance levels, central bank input, and major economic releases concerning the relevant economies. However, there are times when all these factors take a back seat to something bigger, and when you can identify a time like this, it can be relatively easy to make some good profit. We are now in such a time, and the “something bigger” I am talking about is the sharp fall in the U.S. stock market from an all-time high with very big volatility.
 When stocks suddenly become very risky, and fall sharply, investors start to panic and get forced into liquidation. This creates an avalanche of funds which are looking for a safe home until the trouble comes to an end, i.e. money starts looking for “safe-havens”. The “safe-haven” currencies are the U.S. Dollar, the Japanese Yen, and the Swiss Franc. All these currencies have been going up since the stock sell-off began a couple of weeks ago. Almost everything else is going down: stocks, commodities, and the “riskier” currencies. Even the Euro and Gold have suffered, and these assets have also acted as safe-havens in the past, especially Gold. This might be telling us that the current sell-off is truly quite fearful and more about liquidation into cash than rotating investments into safer assets.
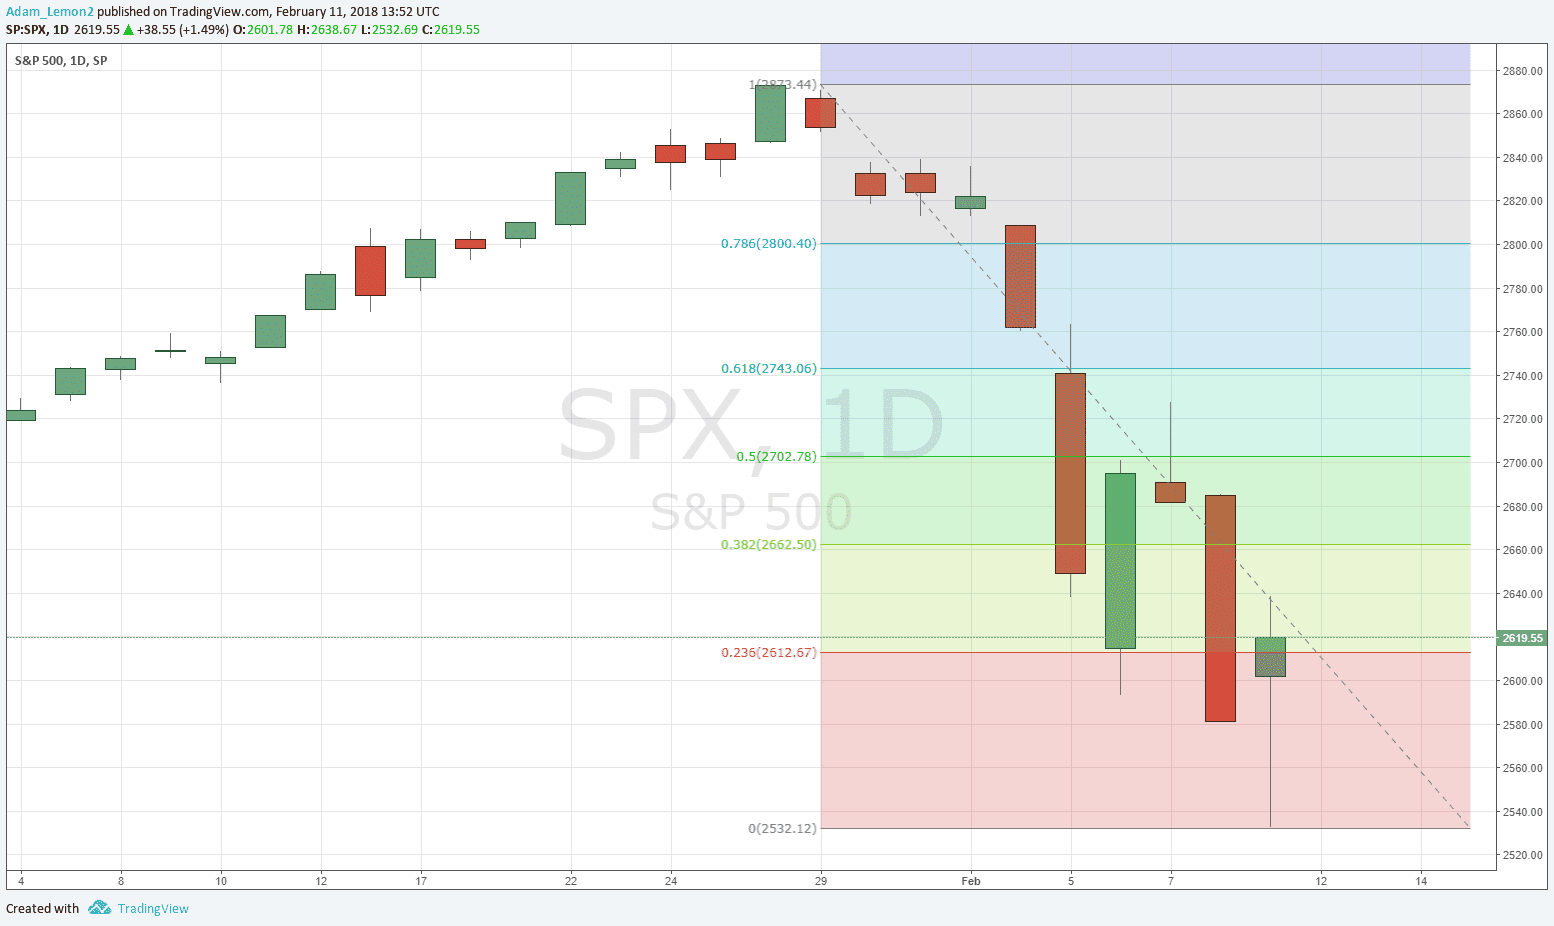
What this means for traders, is that despite the long-term trends against the U.S. Dollar and in favor of other currencies and assets, everything is moving strongly counter-trend, and you must decide whether to stick with these trends and hope they come back. I think a better solution is to watch how the stock market is moving, expecting the flight to safety to continue until stocks are stabilizing at a level greater than half of their maximum drop. You can do this yourself by bringing up a chart of the S&P 500 Index and drawing a Fibonacci retracement from the high to the recent low. As shown in the chart below, the 50% level is at about 2702, and of course the number will fall if the price goes on to make a lower low, requiring the retracement measure to be redrawn on the chart. If you want to be truly safe, you can wait for a daily close above the swing high just above the 50% level at about 2728.

