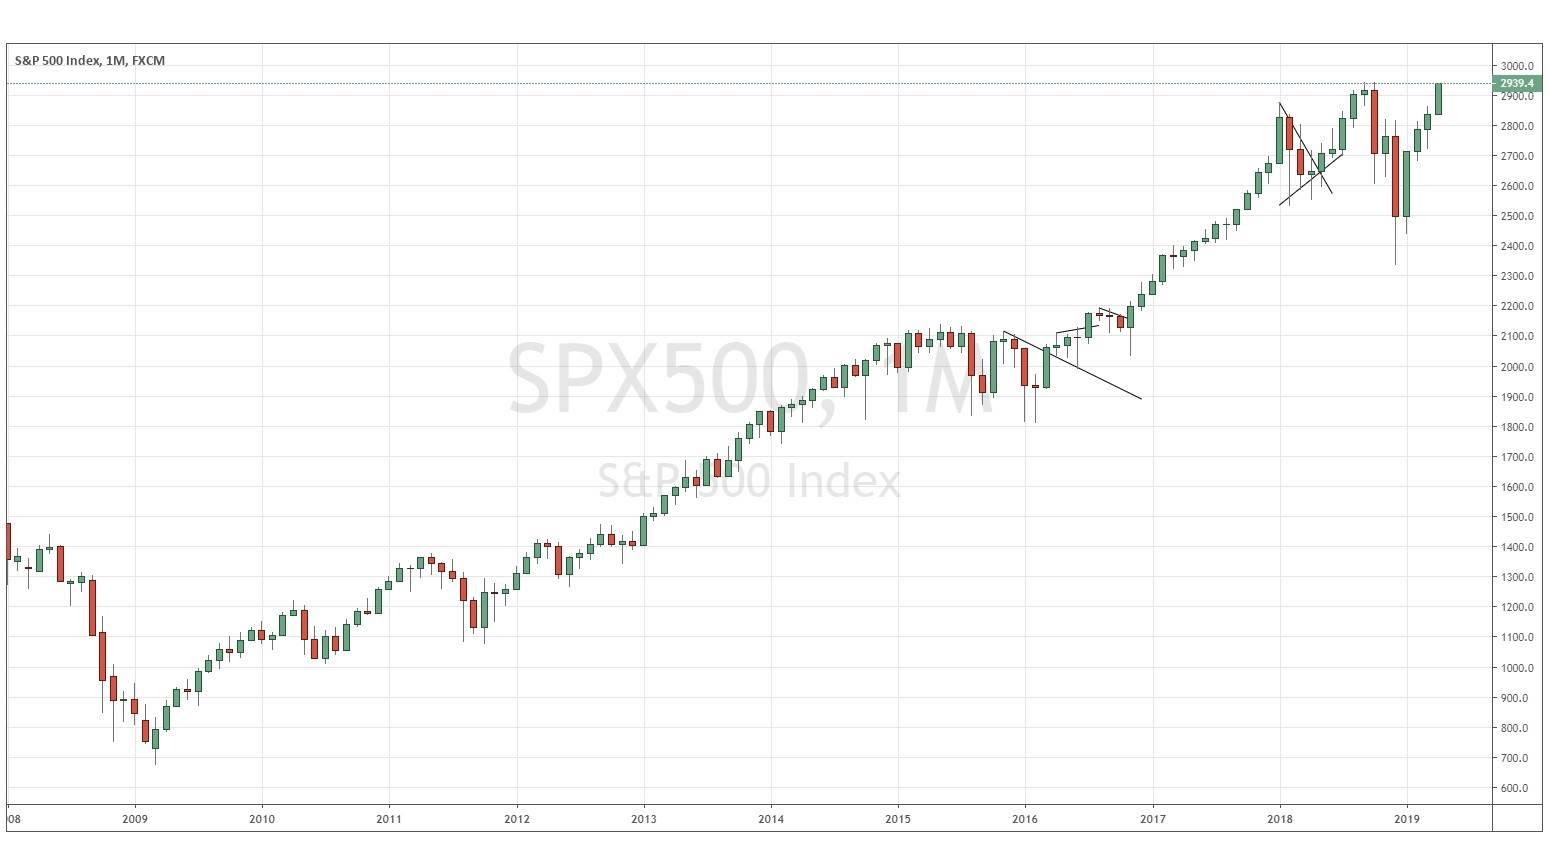
While looking at the charts this weekend, I am getting very excited when I zoom out to the monthly S&P 500 Index chart. Not only does it look very bullish showing truly strong momentum, not only is it very close to its high – it has also reached a level just a couple of points off its all-time high which was reached during September 2018. Look for yourself:
If you’re wondering why I get so excited about all-time high prices, particularly in the U.S. stock market, it is because I have done research on the past performance of the S&P Index which shows that the price closing at an all-time high gives you the best technical trading edge which exists for the retail speculator – or at least, I haven’t been able to find anything better. I wrote a piece a couple of years ago showing that a daily close at an all-time high bought and held for a week on the S&P 500 Index has produced, over recent years, an average return of 0.65% per trade. It is not often that you can find a strategy which has performed as well as this, and these statistics reflect the historical performance over a very long period: between 1971 and 2016. It gets even better: of all the 820 trades generated by this system during this period, 54.27% of them were winning, profitable trades, achieved using a time-based exit. If you can find a profitable edge with a time-based exit method, I believe you should have particularly strong faith in it, because it removes any potential for curve-fitting through the exit method.
This strategy of buying “all-time highs” has historically worked incredibly well with the main U.S. stock market index, but it does tend to work well in other asset classes too, even in Forex. Although usually in Forex you shouldn’t be too hung up on the high being “all-time”, even a time period as short as 50 days is enough to give you an edge, if the short-term volatility on the entry is above-average.

