When we talk about trend reversals, it's important to know how to spot and trade a trend, but it's equally important to know how to spot a trend reversal. This is crucial because you don't want to be caught in a trend once it has ended, and you also want to be able to get into the new trend.
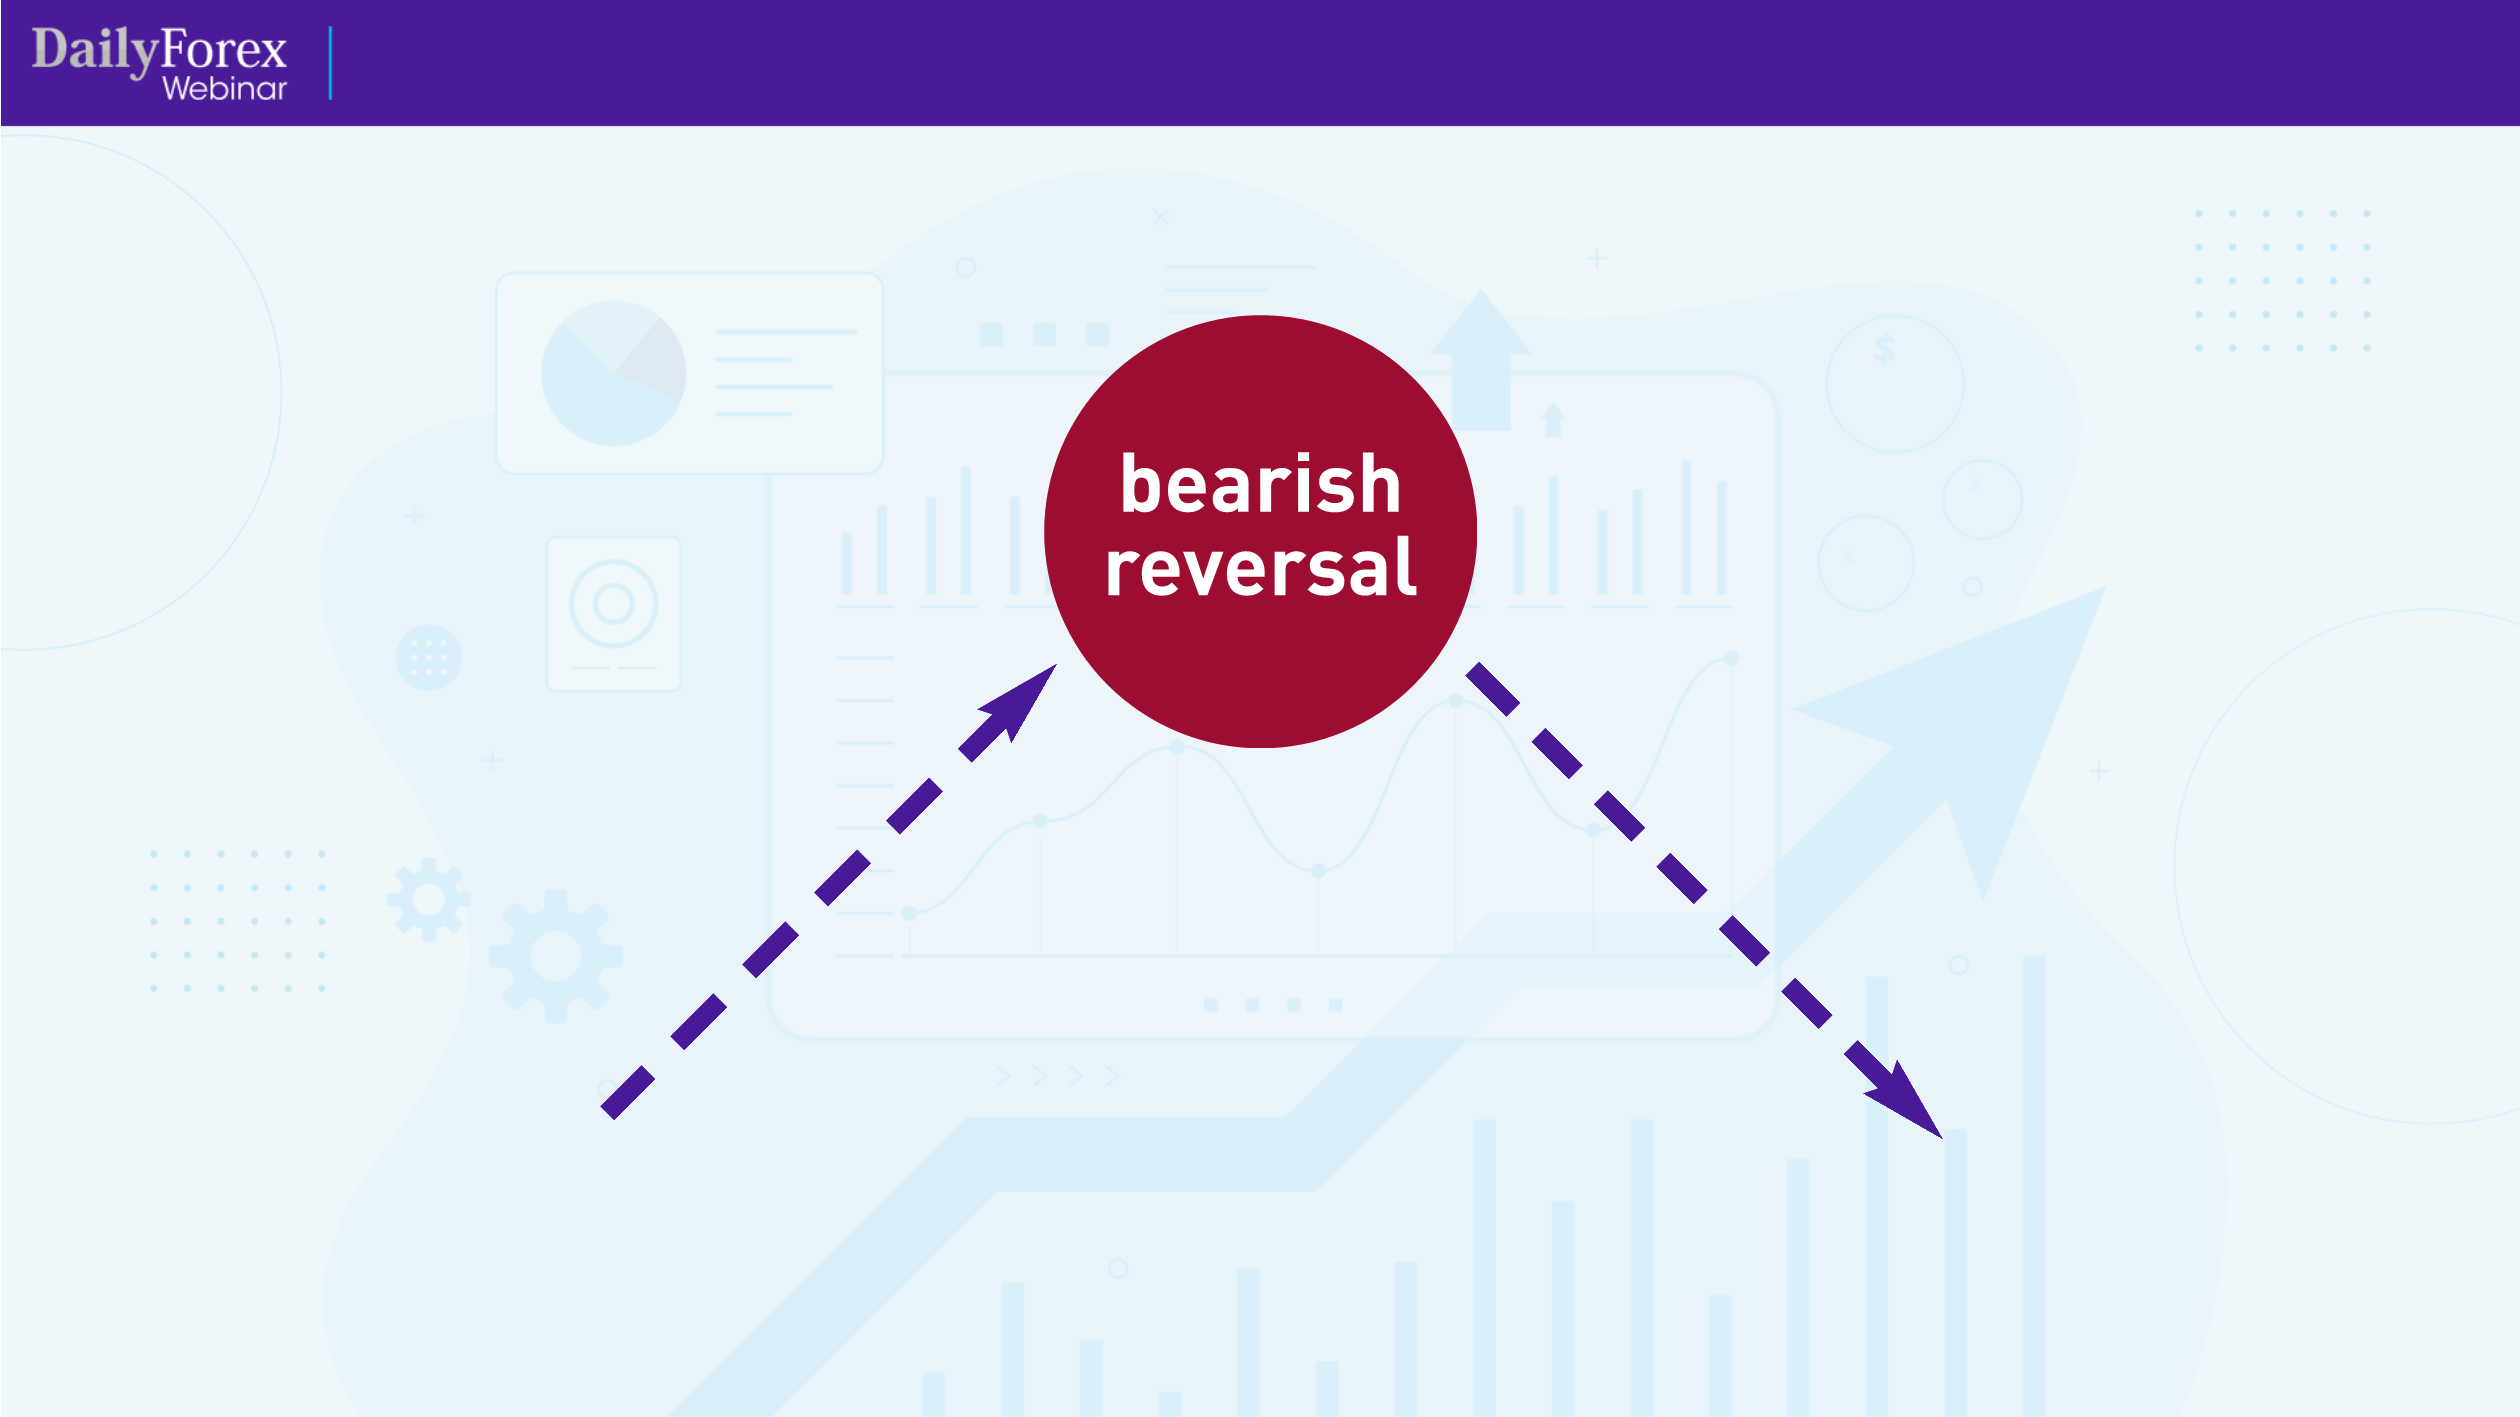
Let's say the market is moving upwards in a bullish trend, and then reverses downward in a bearish trend:
That gap between the two trends is the reversal, where the price paused and then reversed direction. In this case, it's a bearish reversal, since the trend changed to a downward direction.
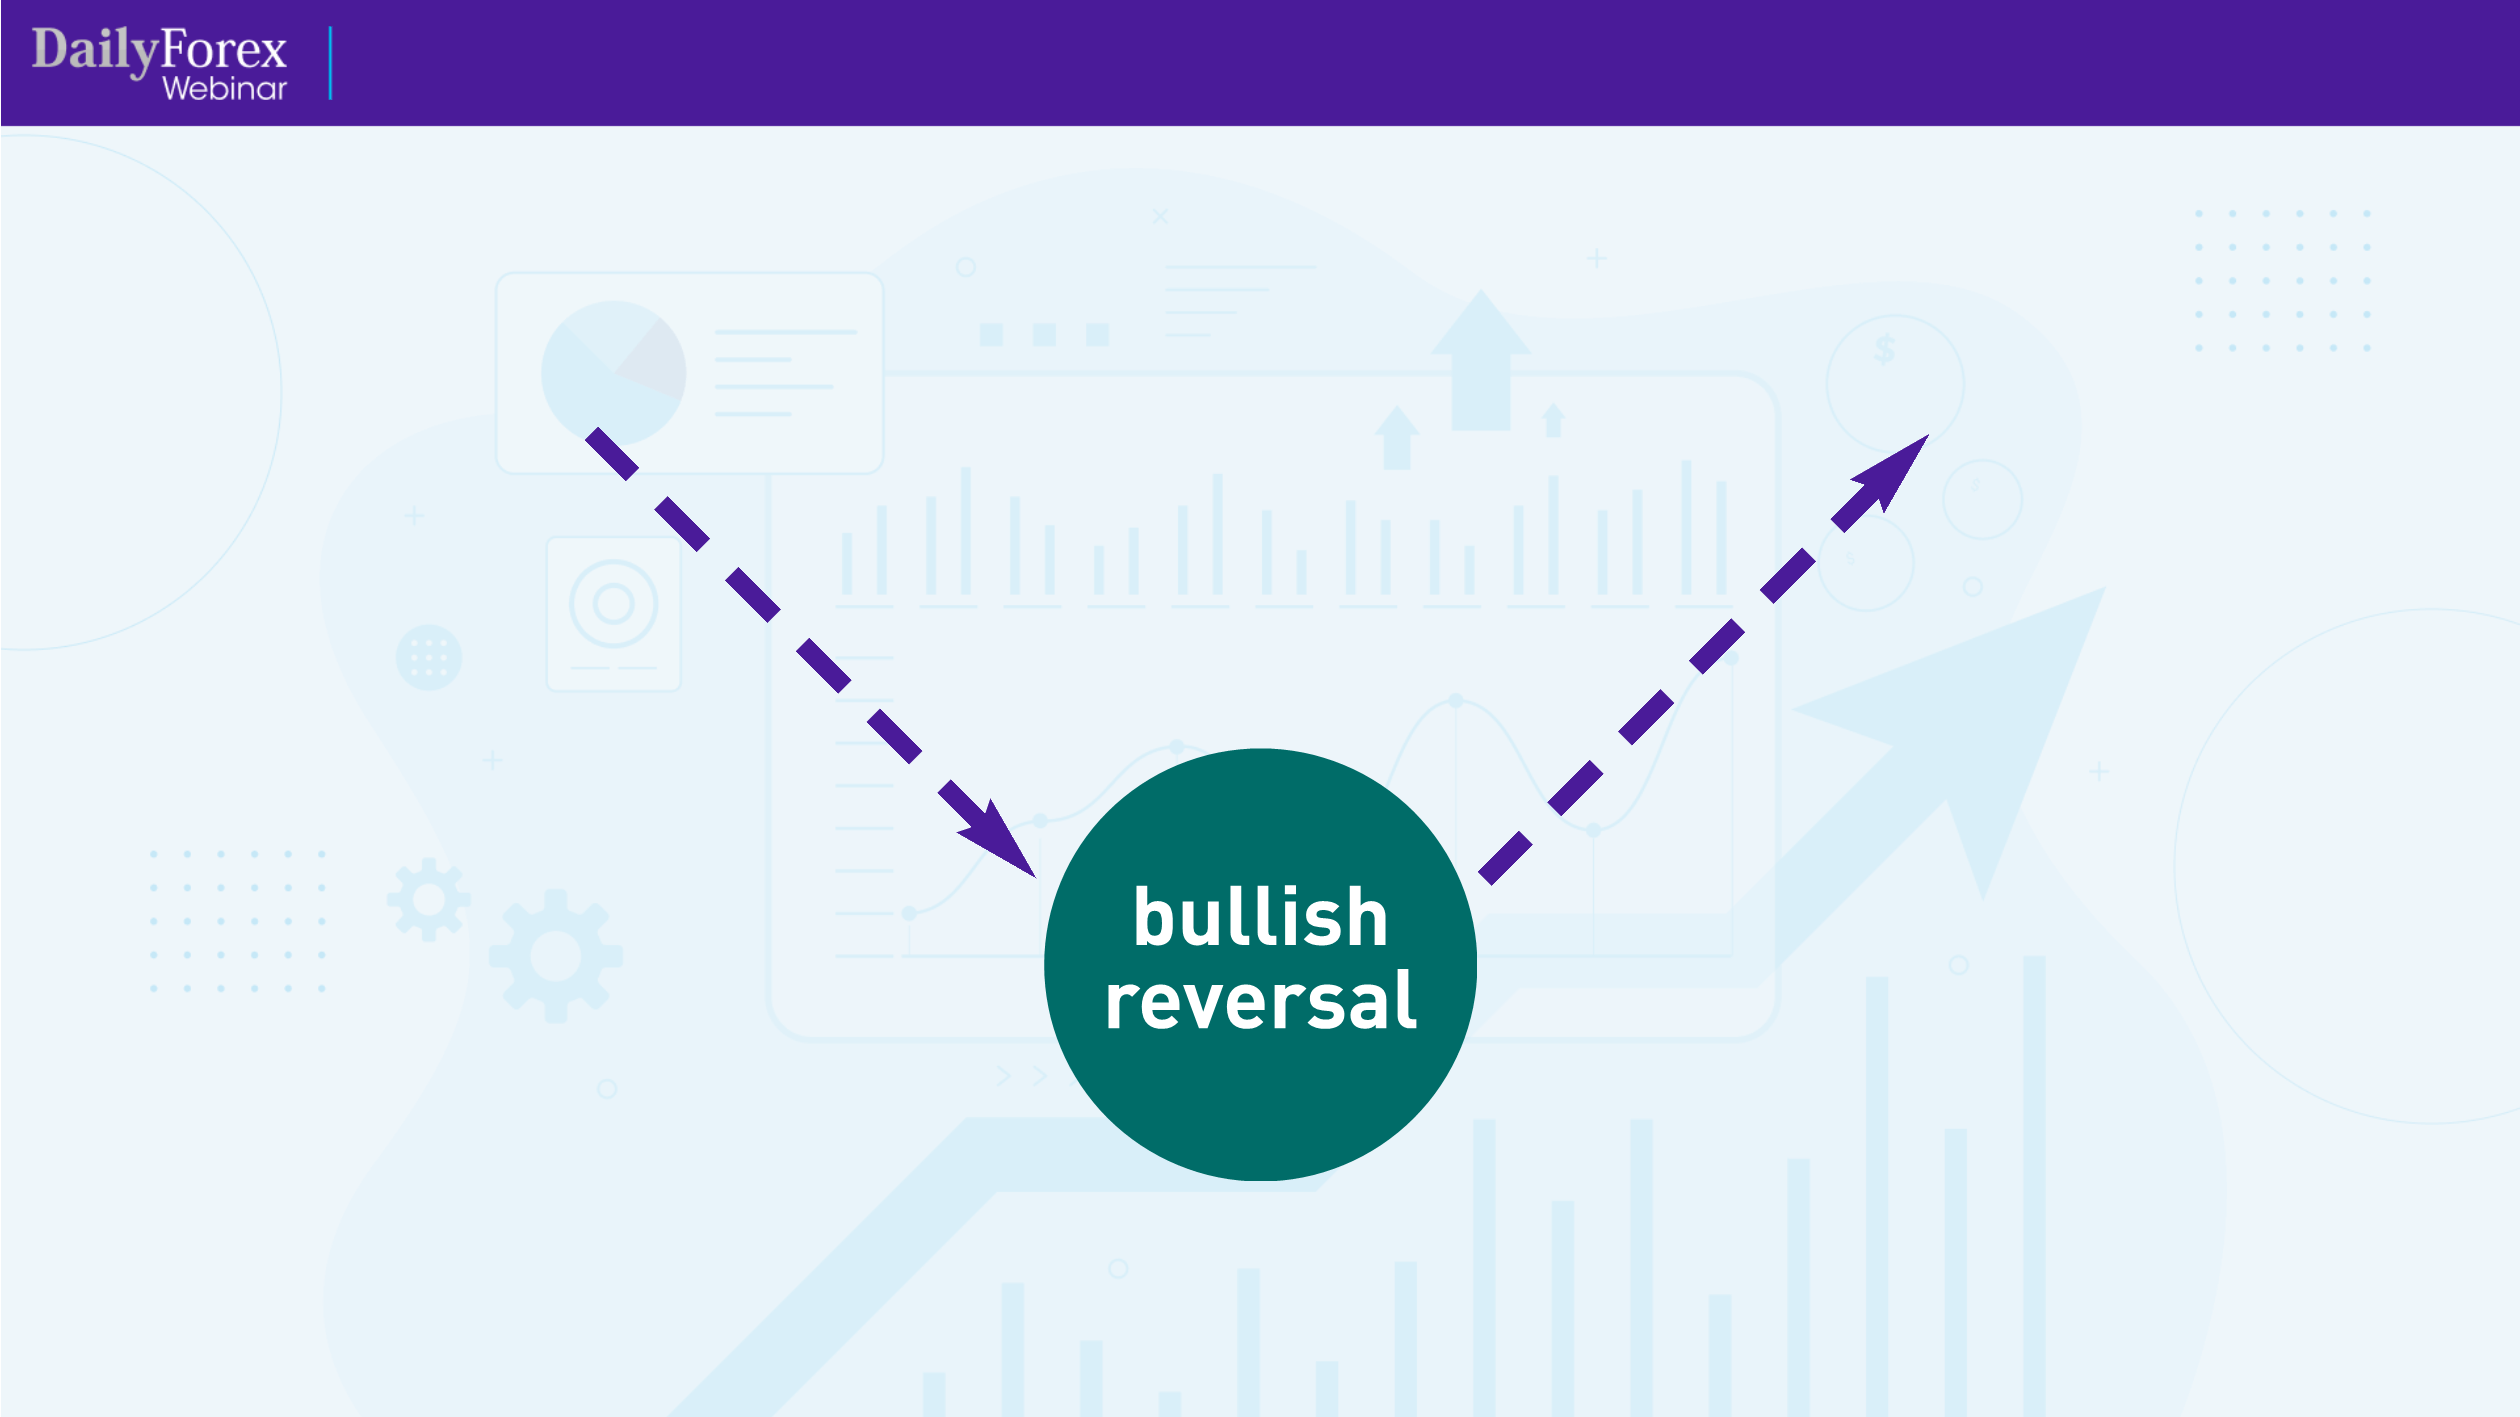
Of course, a bullish reversal would look exactly the opposite:
So what are the tell-tale signs in a chart pattern that tell us there is a trend reversal?
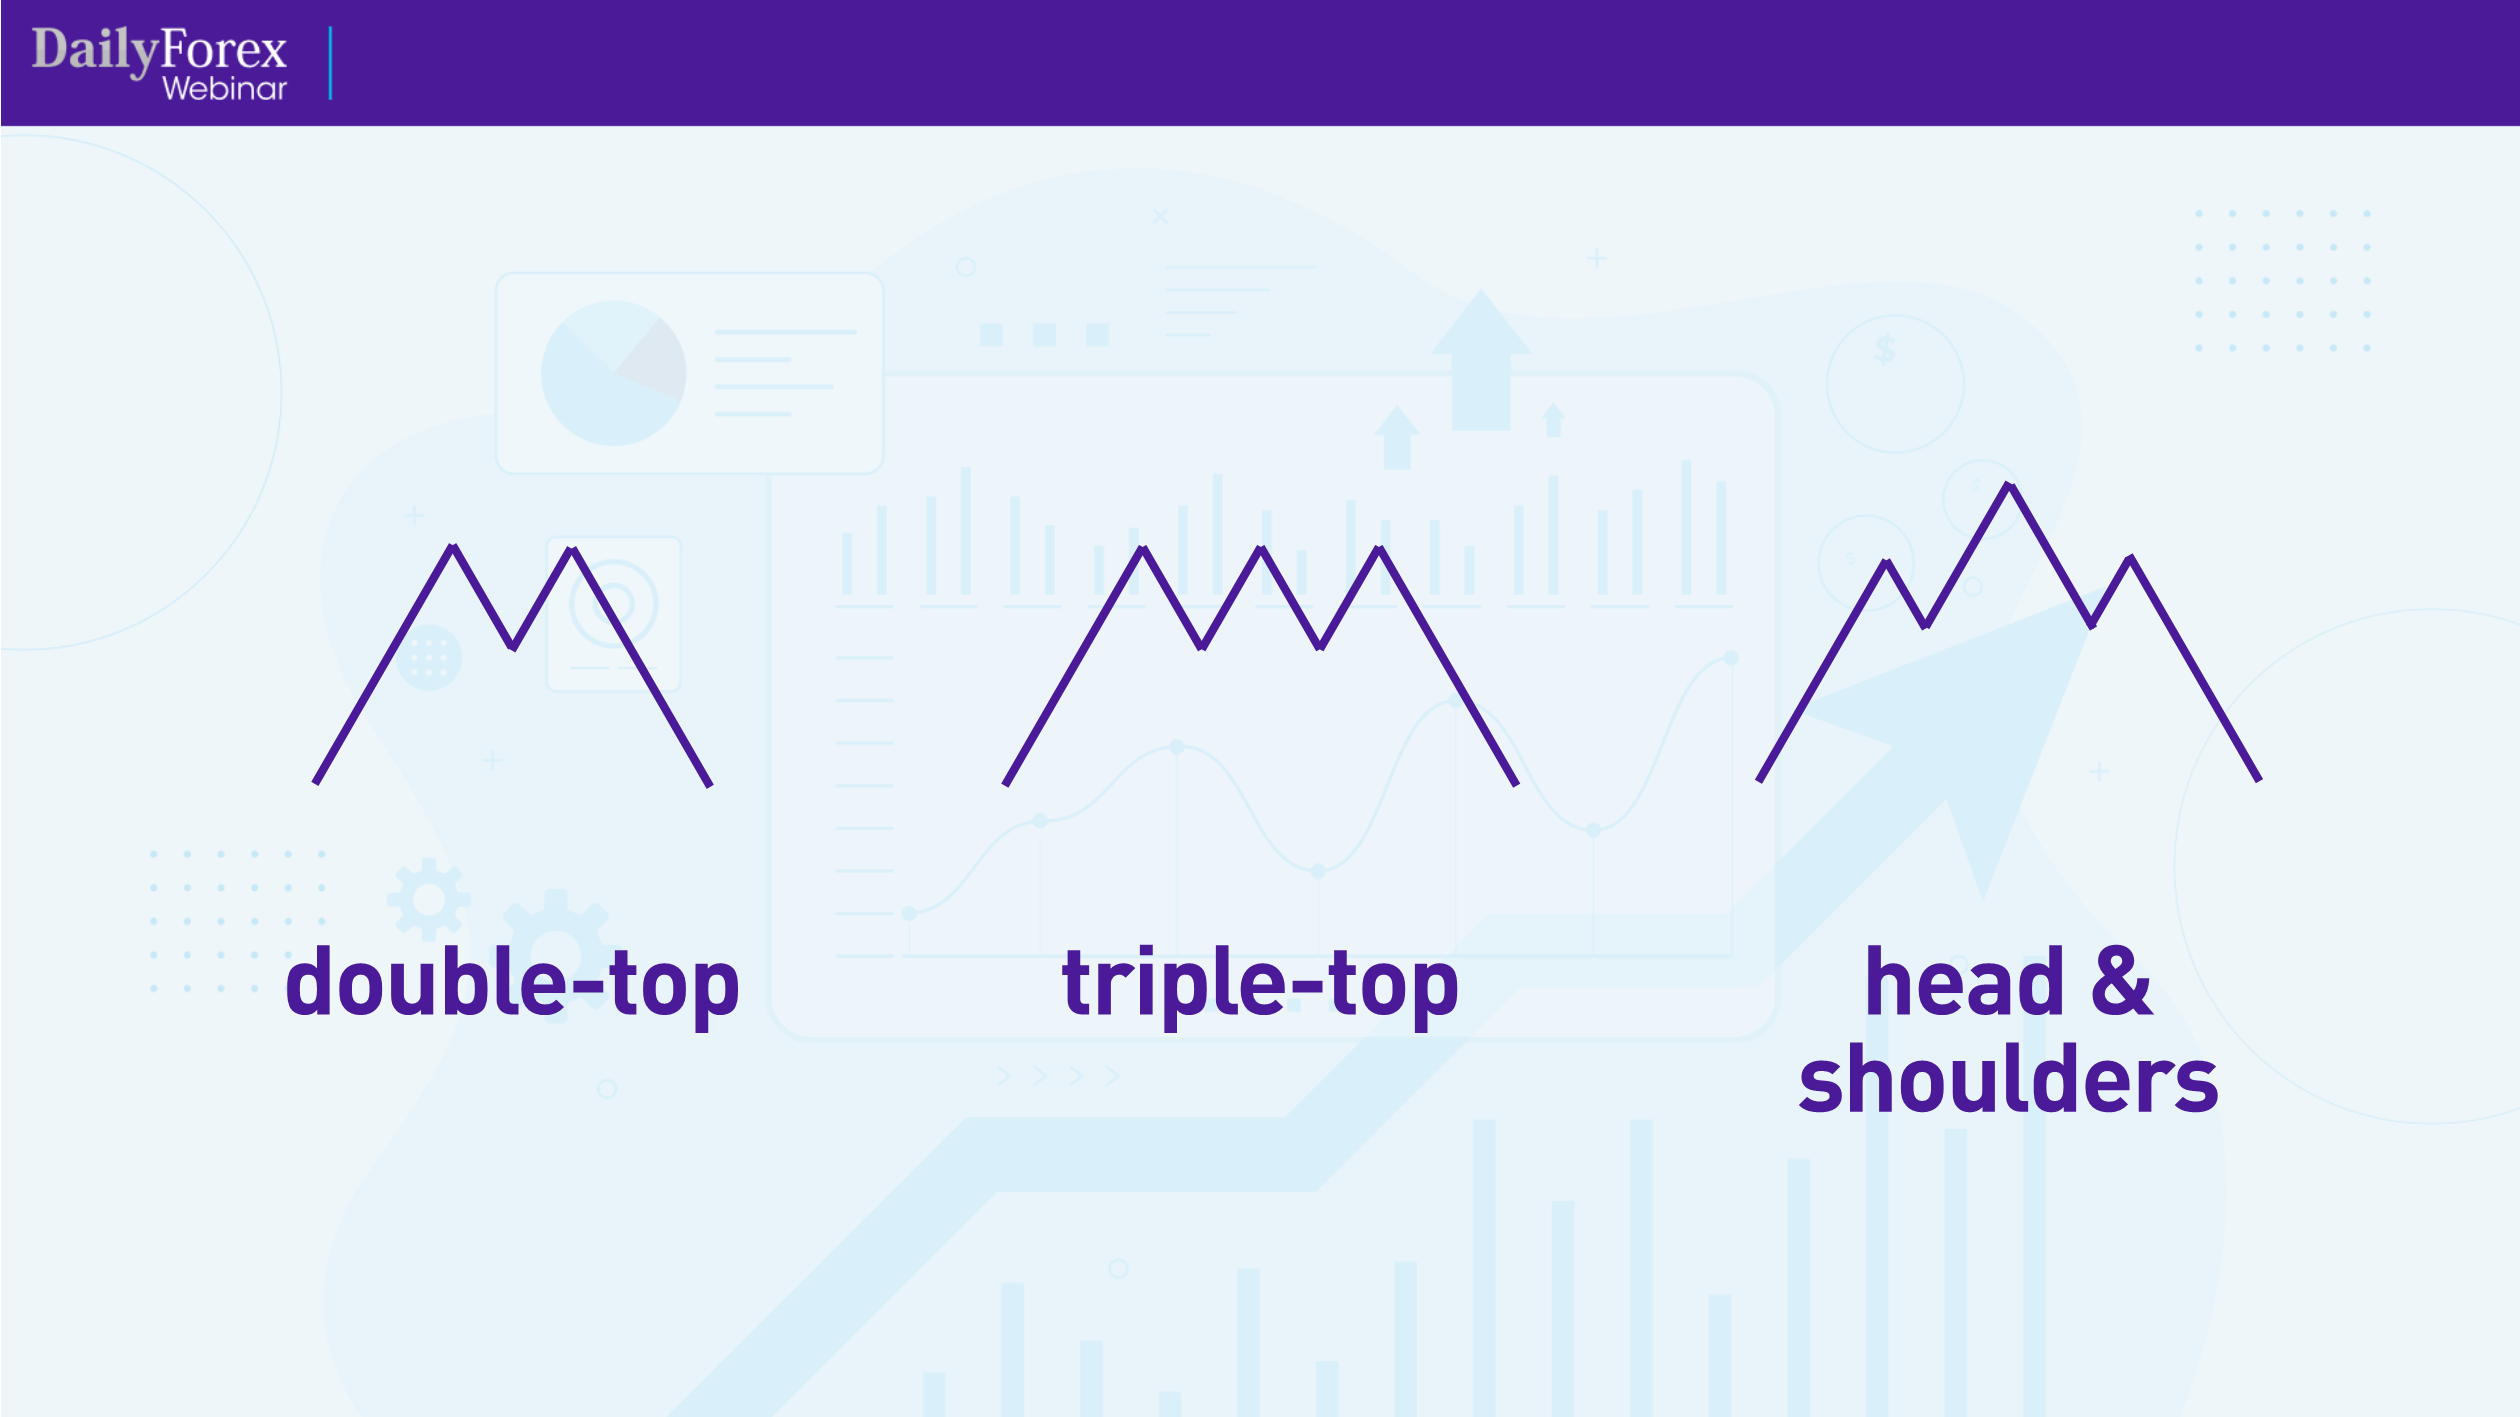
Let's look at a few basic bearish reversal patterns:
The first type of reversal pattern is called a “double top”. This is when the price forms a resistance, then retraces and hits the same resistance level before falling back down. When you see the price hit those two resistance points and break the support in between, it is likely that the trend will reverse downwards.
Another pattern is called the “triple top”. This pattern is stronger than the double top, and happens when the price hits the same resistance level thrice and the support level twice. Once it finally breaks through that support level, it is likely that the trend will experience a bearish reversal.
A variation on the triple top is the “head and shoulders” pattern, which is the most common and considered predictive in nature. It has three peaks, but the middle one is the most prominent. The support line, referred to as the “neckline”, is broken by bears stepping in quickly to push the price downwards in a bearish reversal.
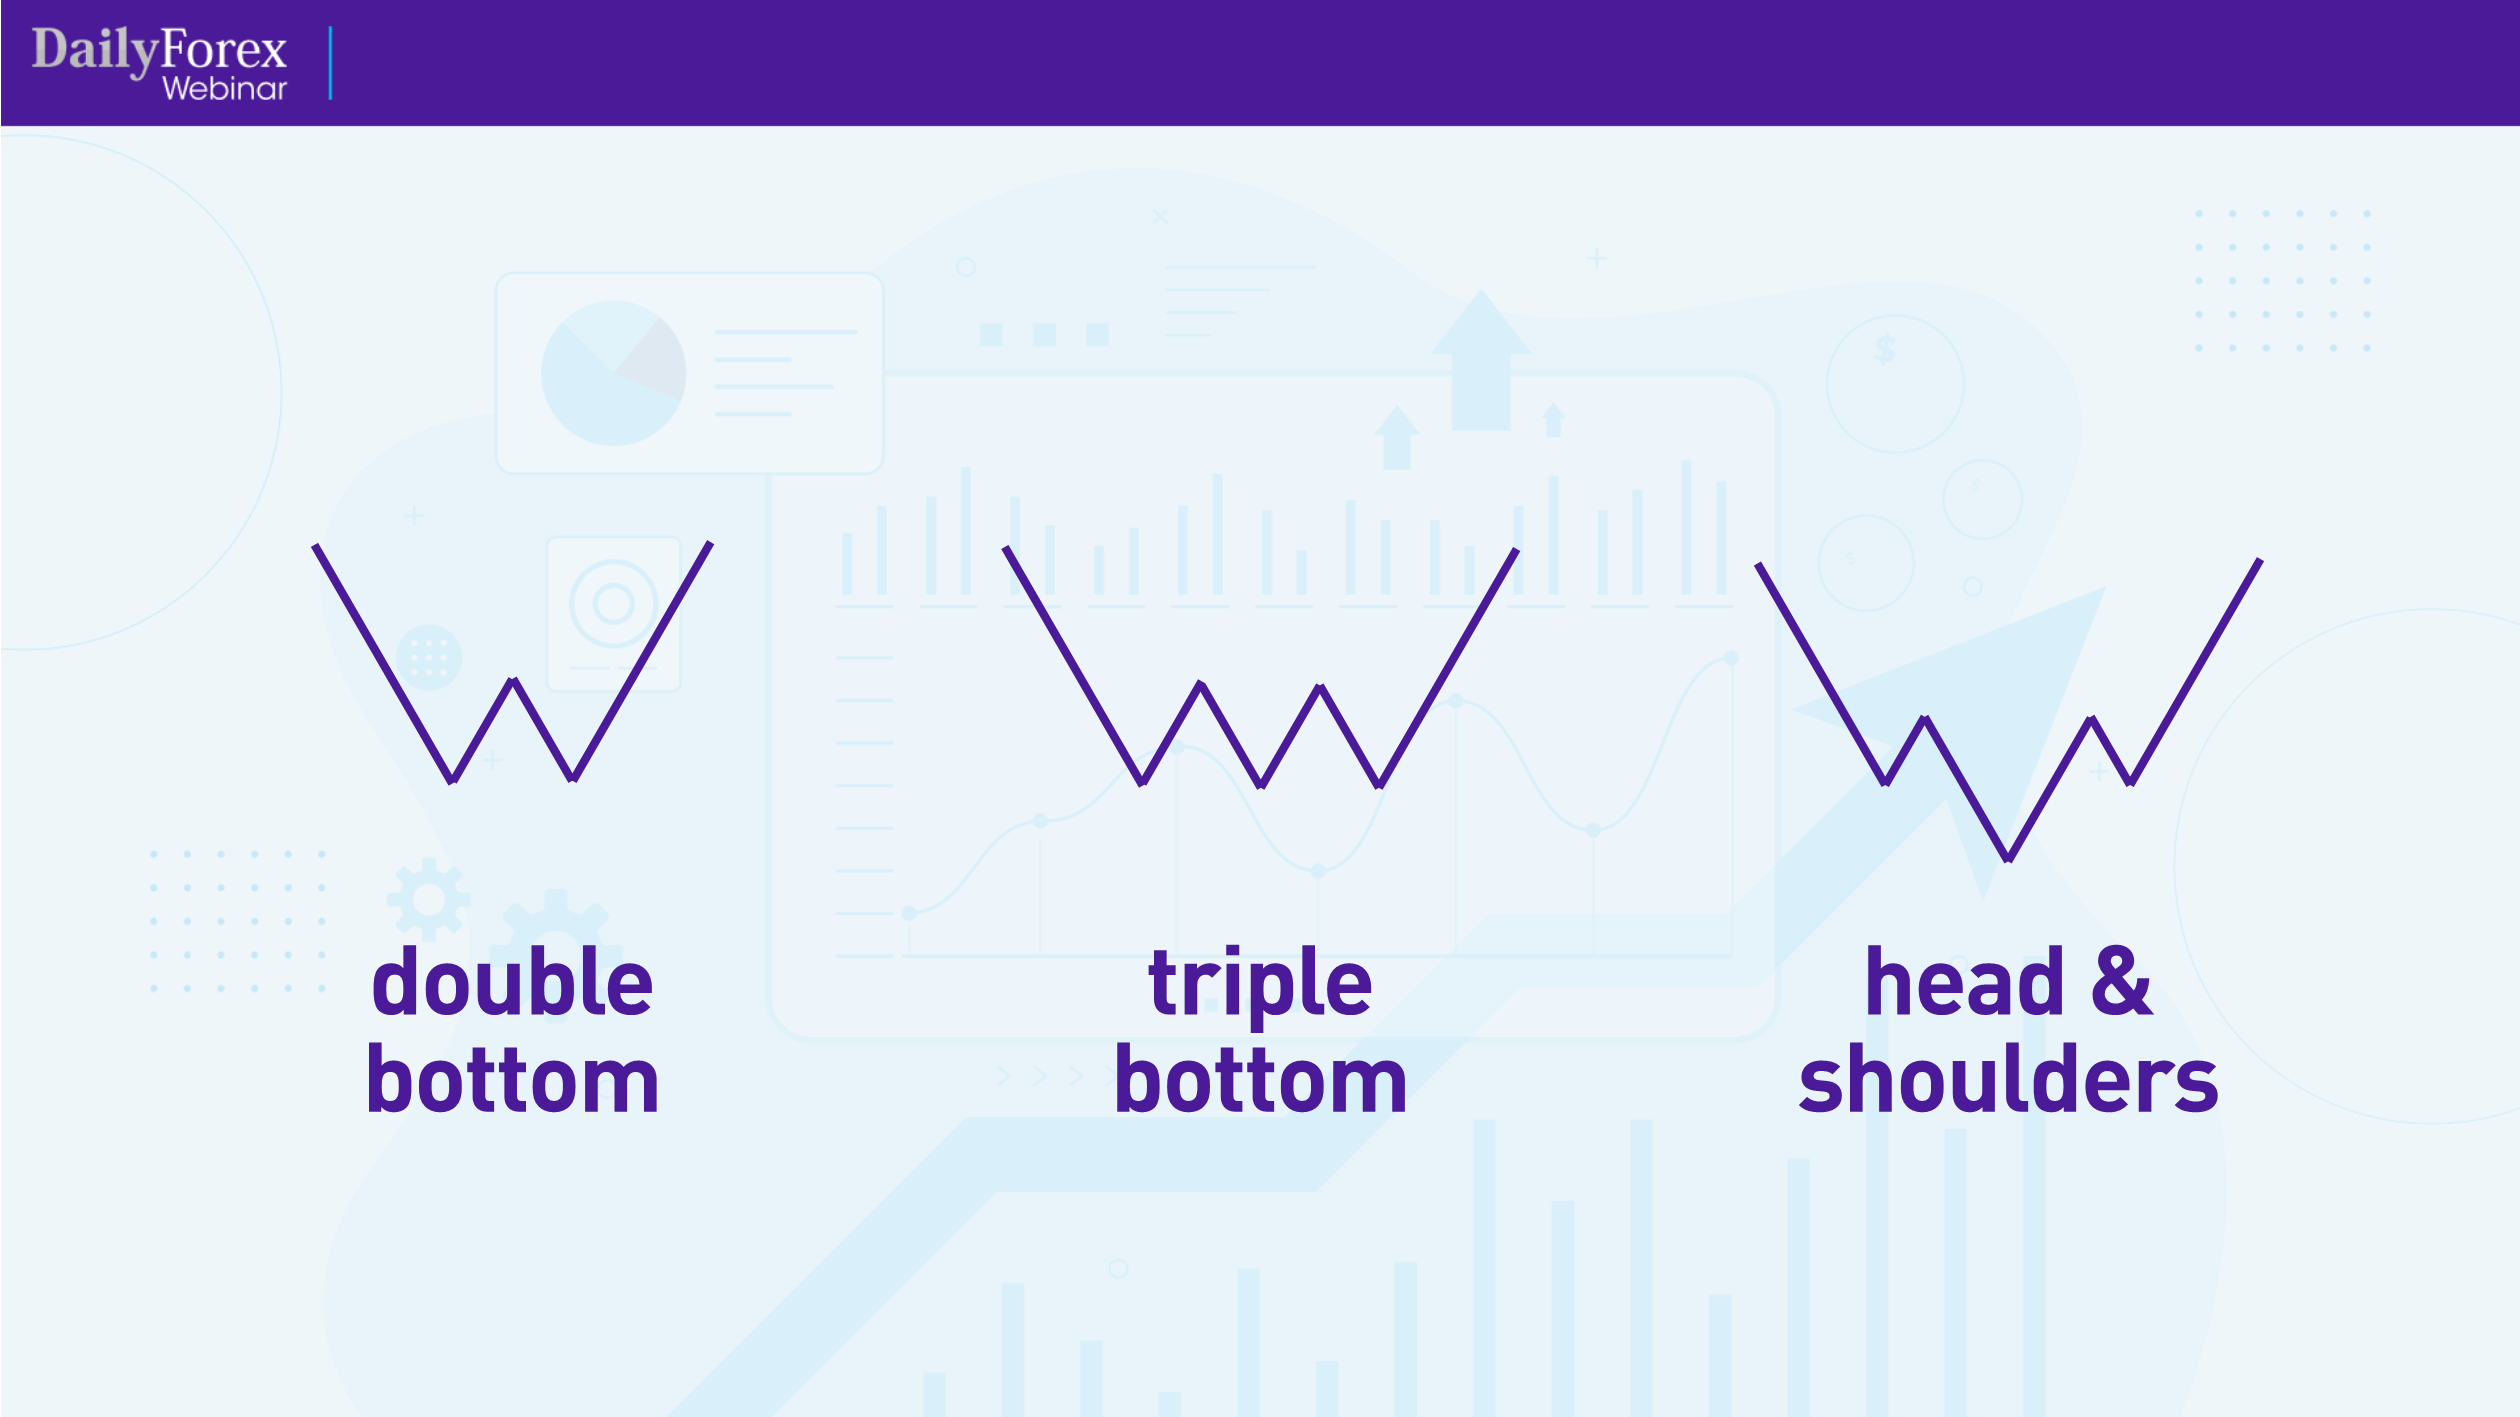
Bullish reversal patterns are essentially mirror images of bearish reversal patterns:
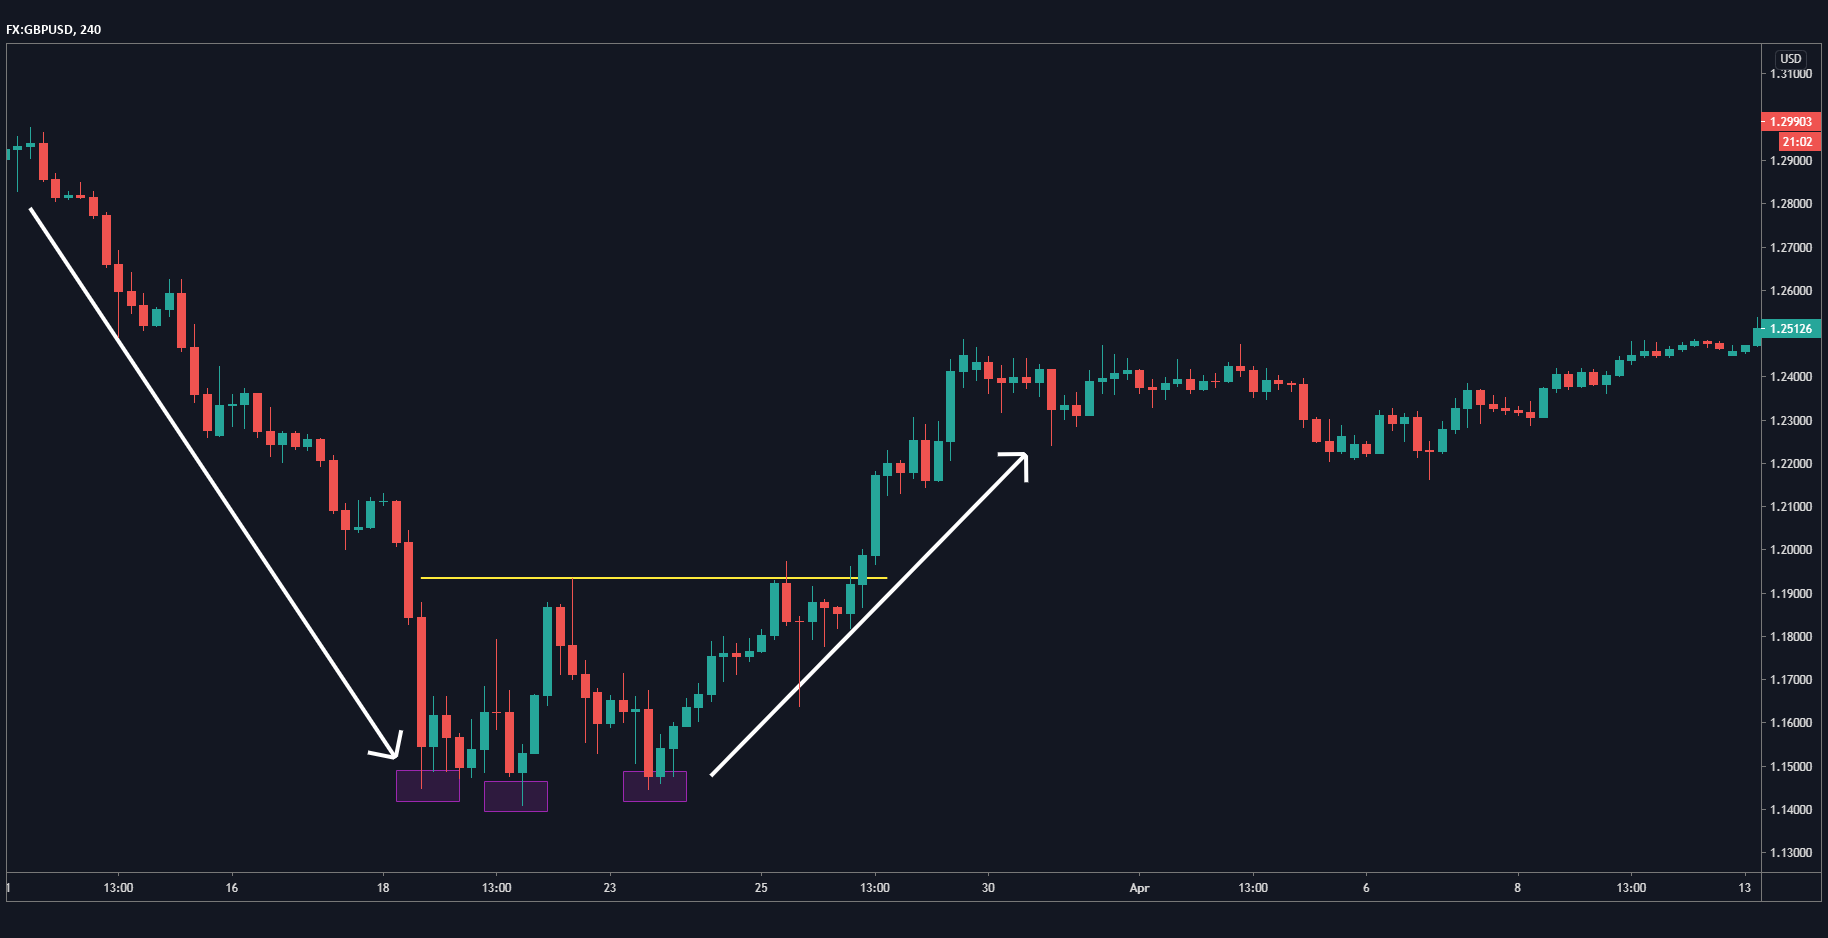
Let's look at a real example of a trend reversal, using the GBP/USD four-hour chart:
The white arrow shows where the trend moved downward quite cleanly, then stopped and made a bullish run. At that point, I'm still thinking that the upward run is just a pullback, and indeed, the bears stepped in to bring the price back down. But the second white arrow shows how the trend in fact underwent a bullish reversal. Now that I see the double bottom formation, I can see that this is a new bullish trend.
You want to of course watch the middle of the double bottom to see if the price breaks through that level, marked by the yellow line.
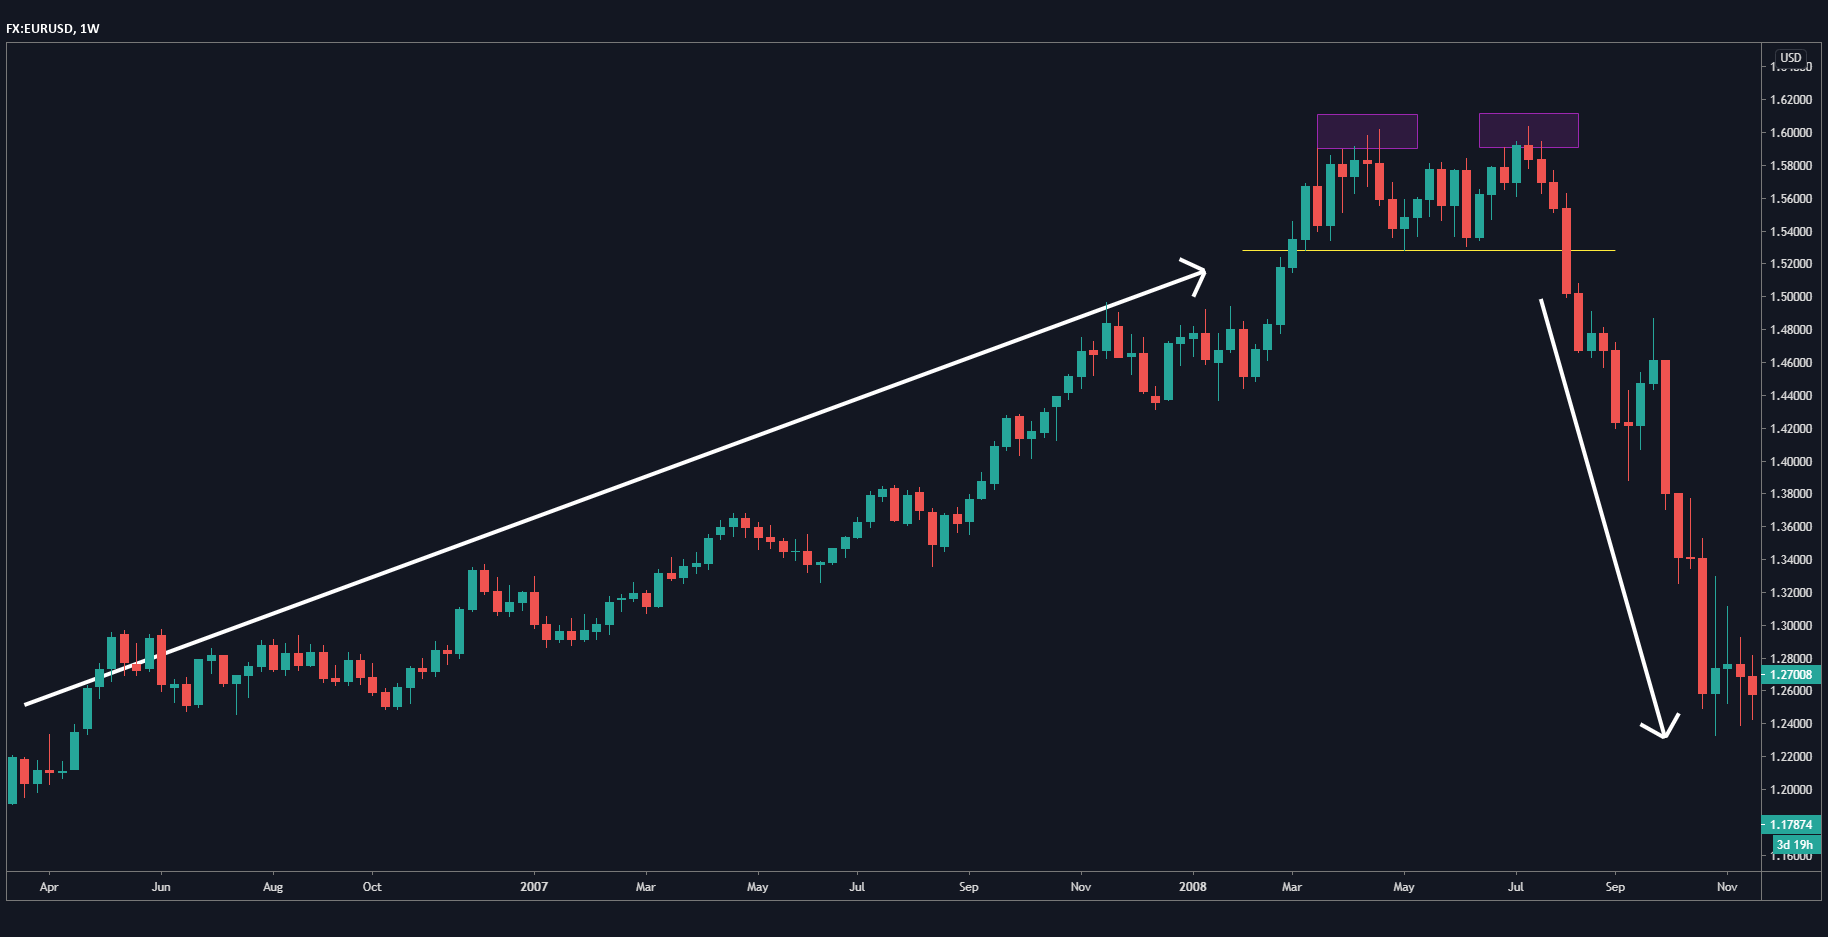
Here is the weekly chart for the EUR/USD:
Given that this is a higher time frame, the trend is more stable, but takes longer to play out. In this scenario, the bullish trend was followed by a double top, and then a bearish reversal when the price flew past that support.
If we look at the EUR/USD before the bullish trend, we see a head and shoulders reversal pattern:
You see how there is the head in the middle flanked by two peaks, with a sloping neckline.
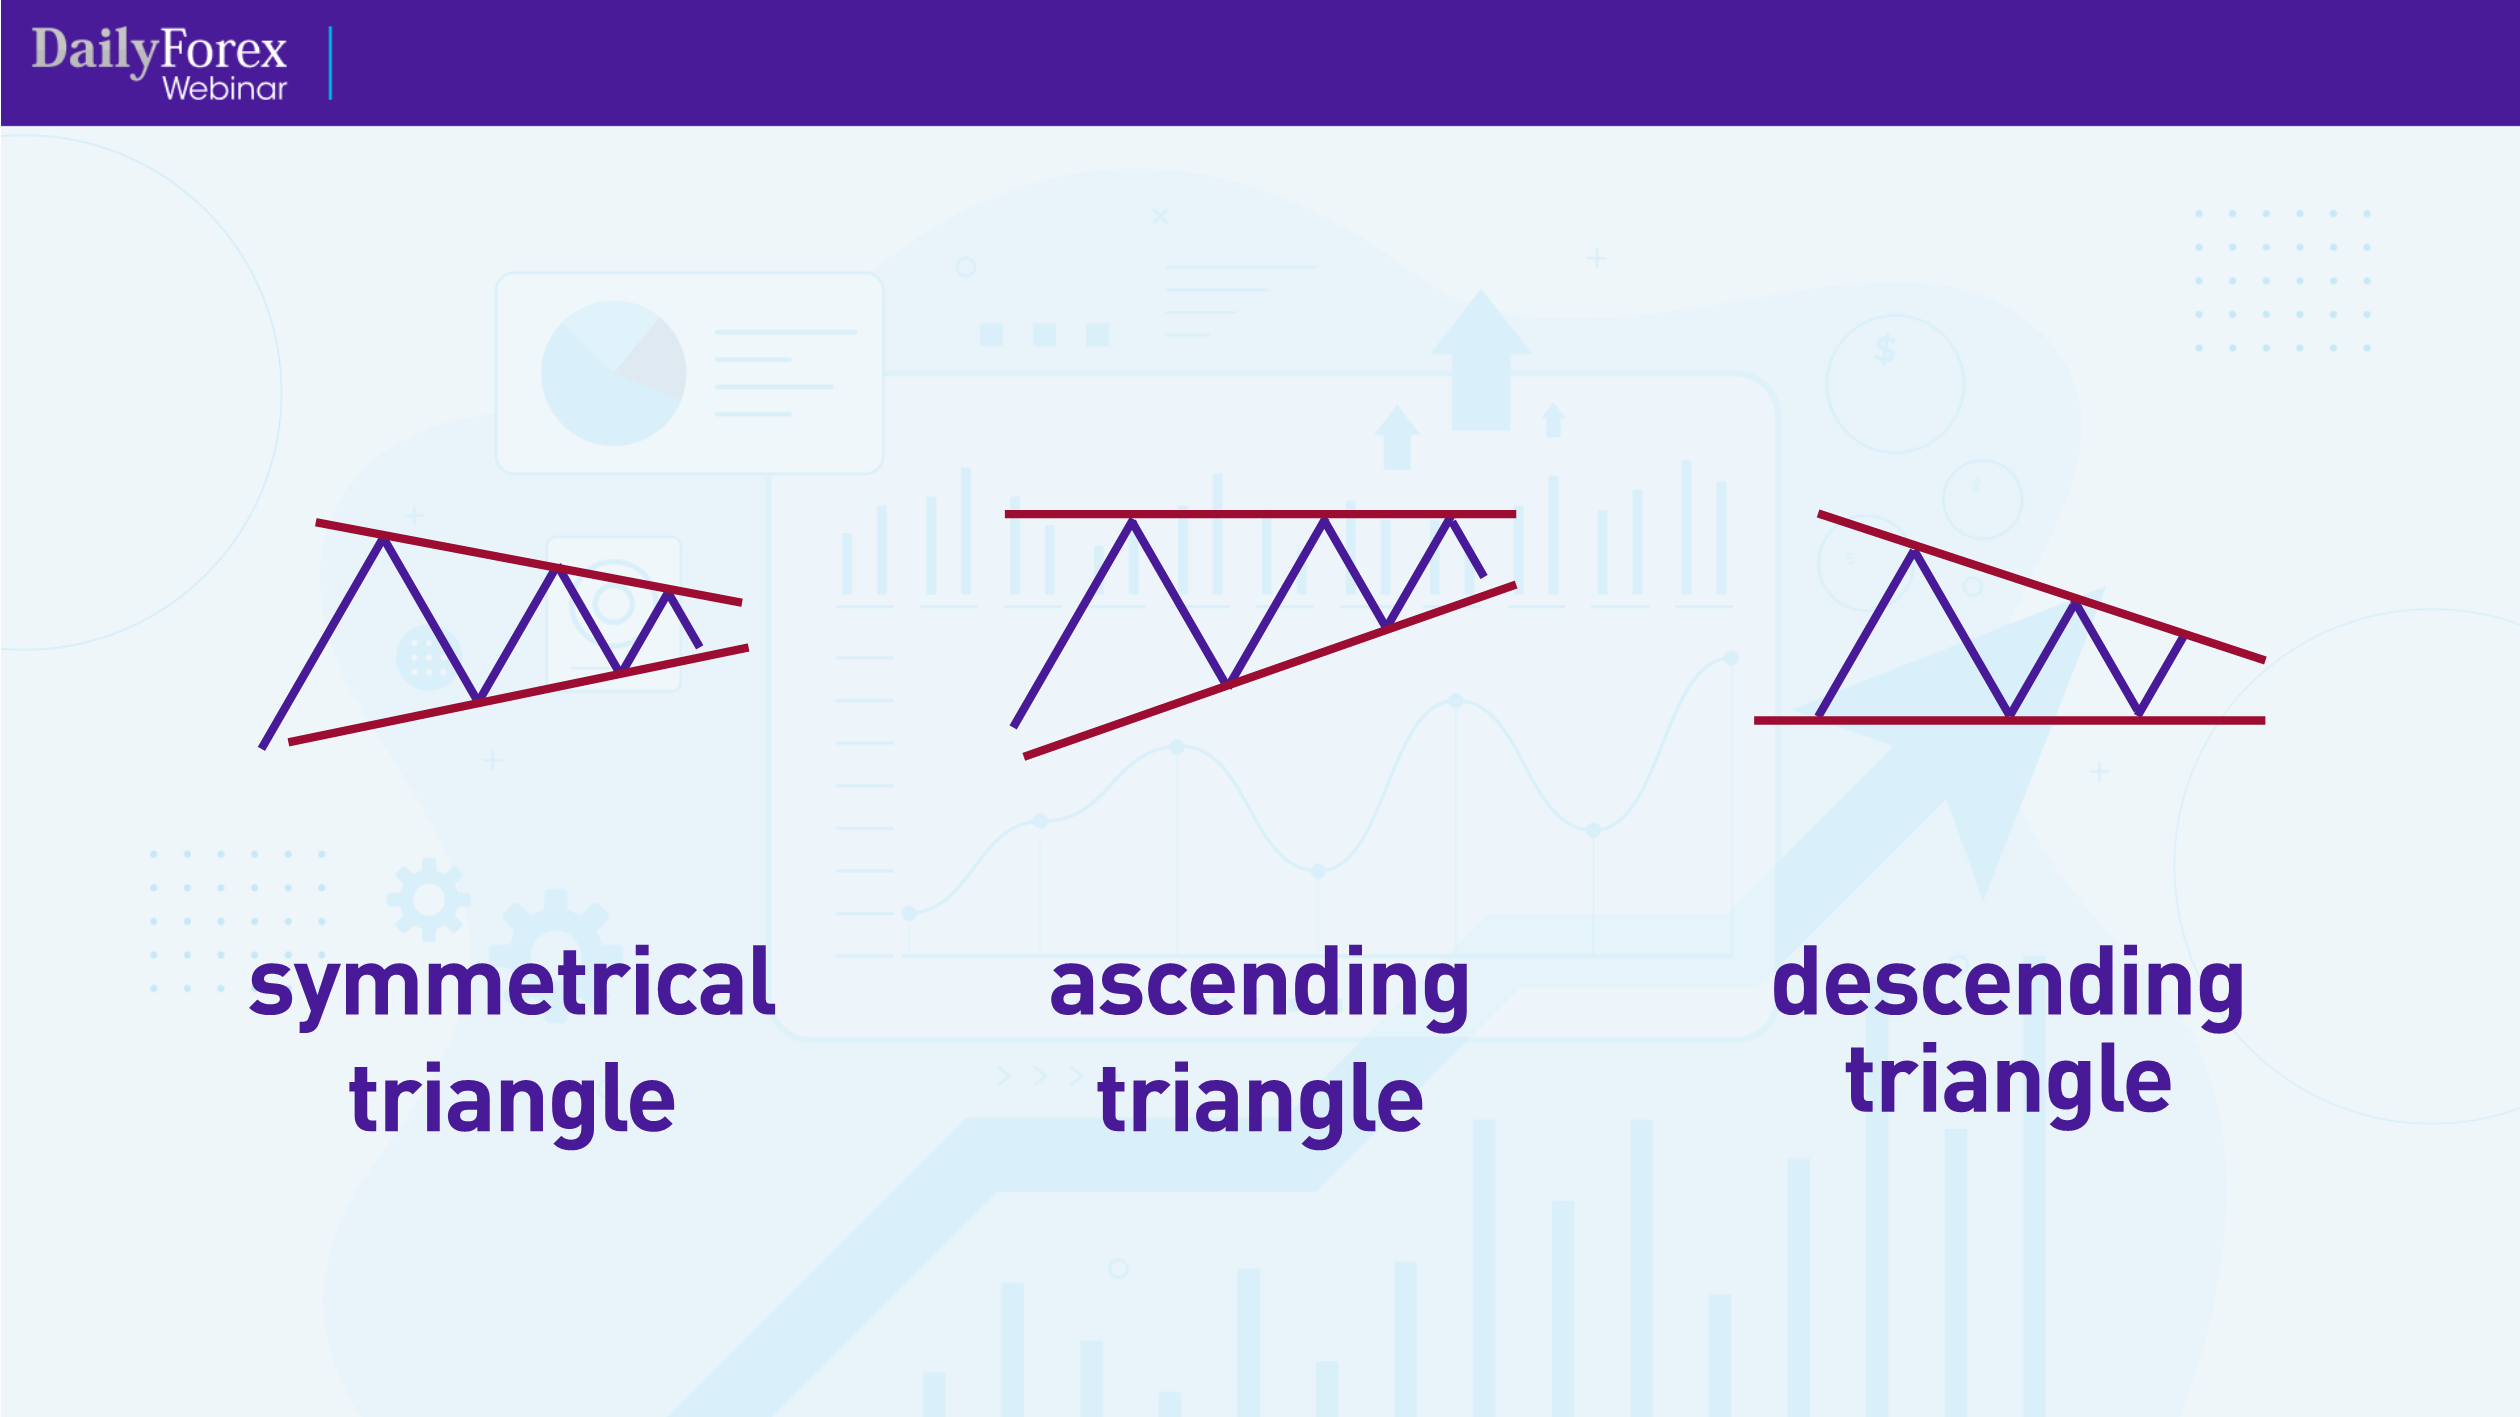
The trend reversal patterns I've mentioned above are “pure” trend reversals. I now want to introduce you to a pattern that is both a trend reversal and a continuation of the same trend, called a “bi-lateral pattern”:
A bi-lateral pattern is characterized by being able to break out in either direction, and its price compresses and forms a triangle. The triangle can be either symmetrical, ascending or descending.
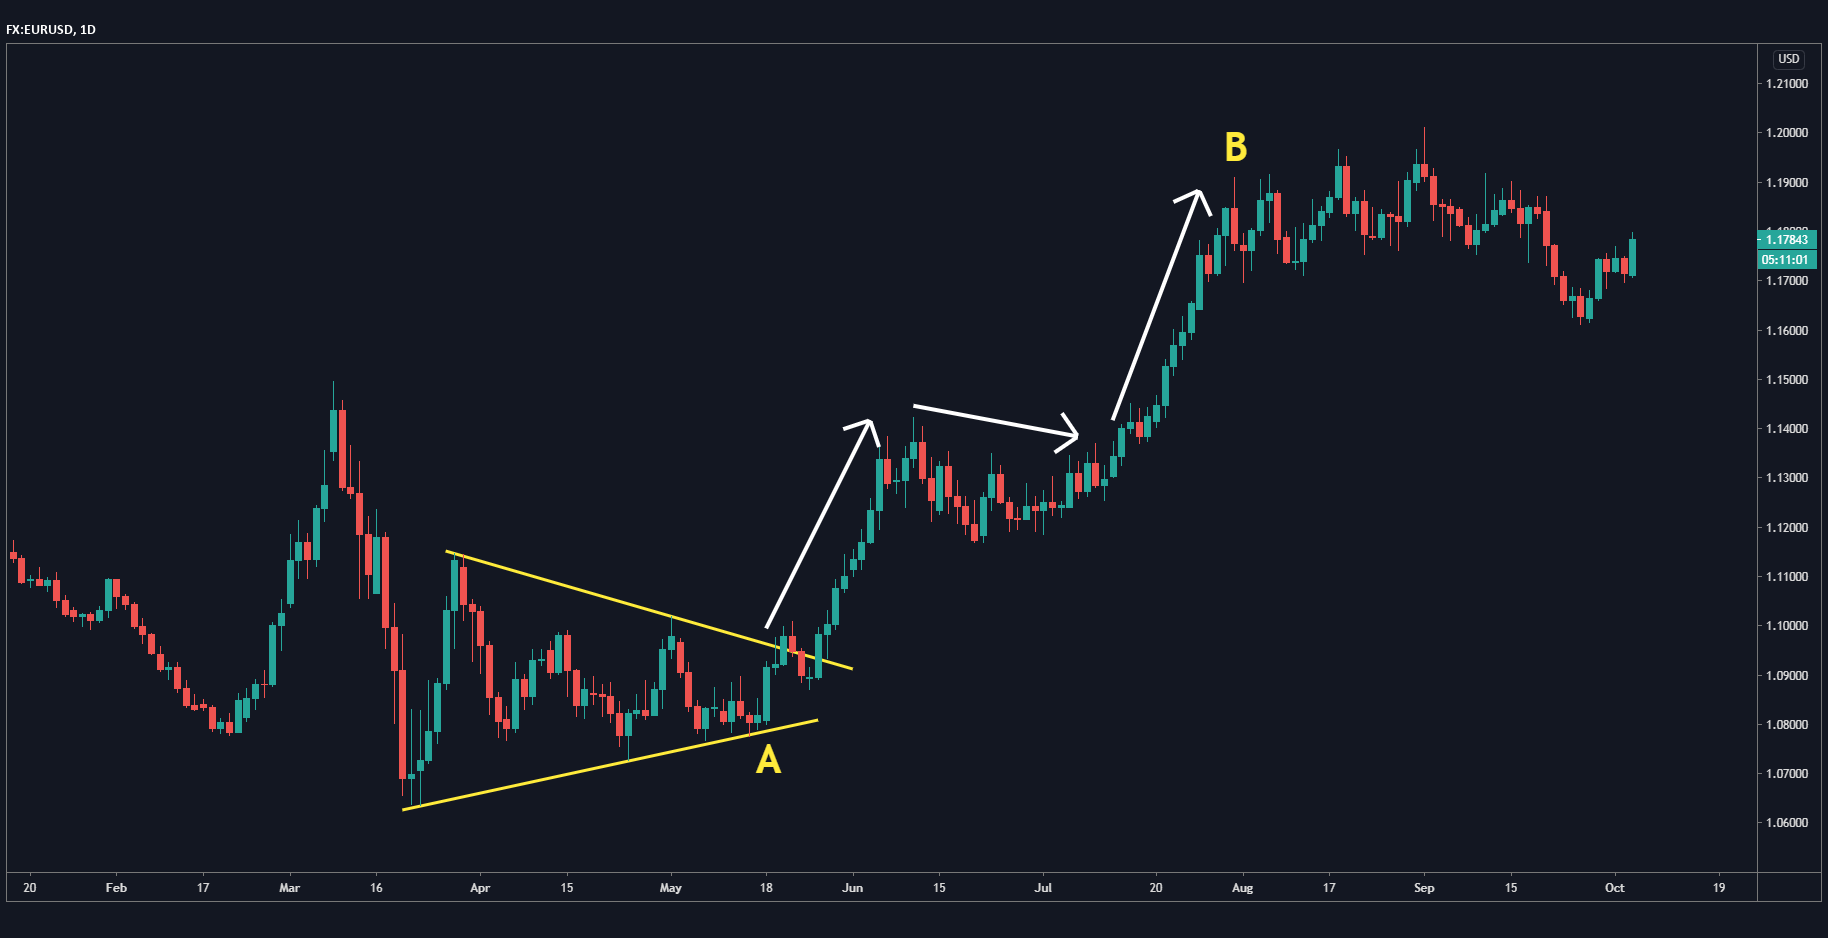
An example can be seen in the daily chart for the EUR/USD:
The triangle, marked by the two yellow lines, follows a downward trend and shows how the price compressed before reversing upward.
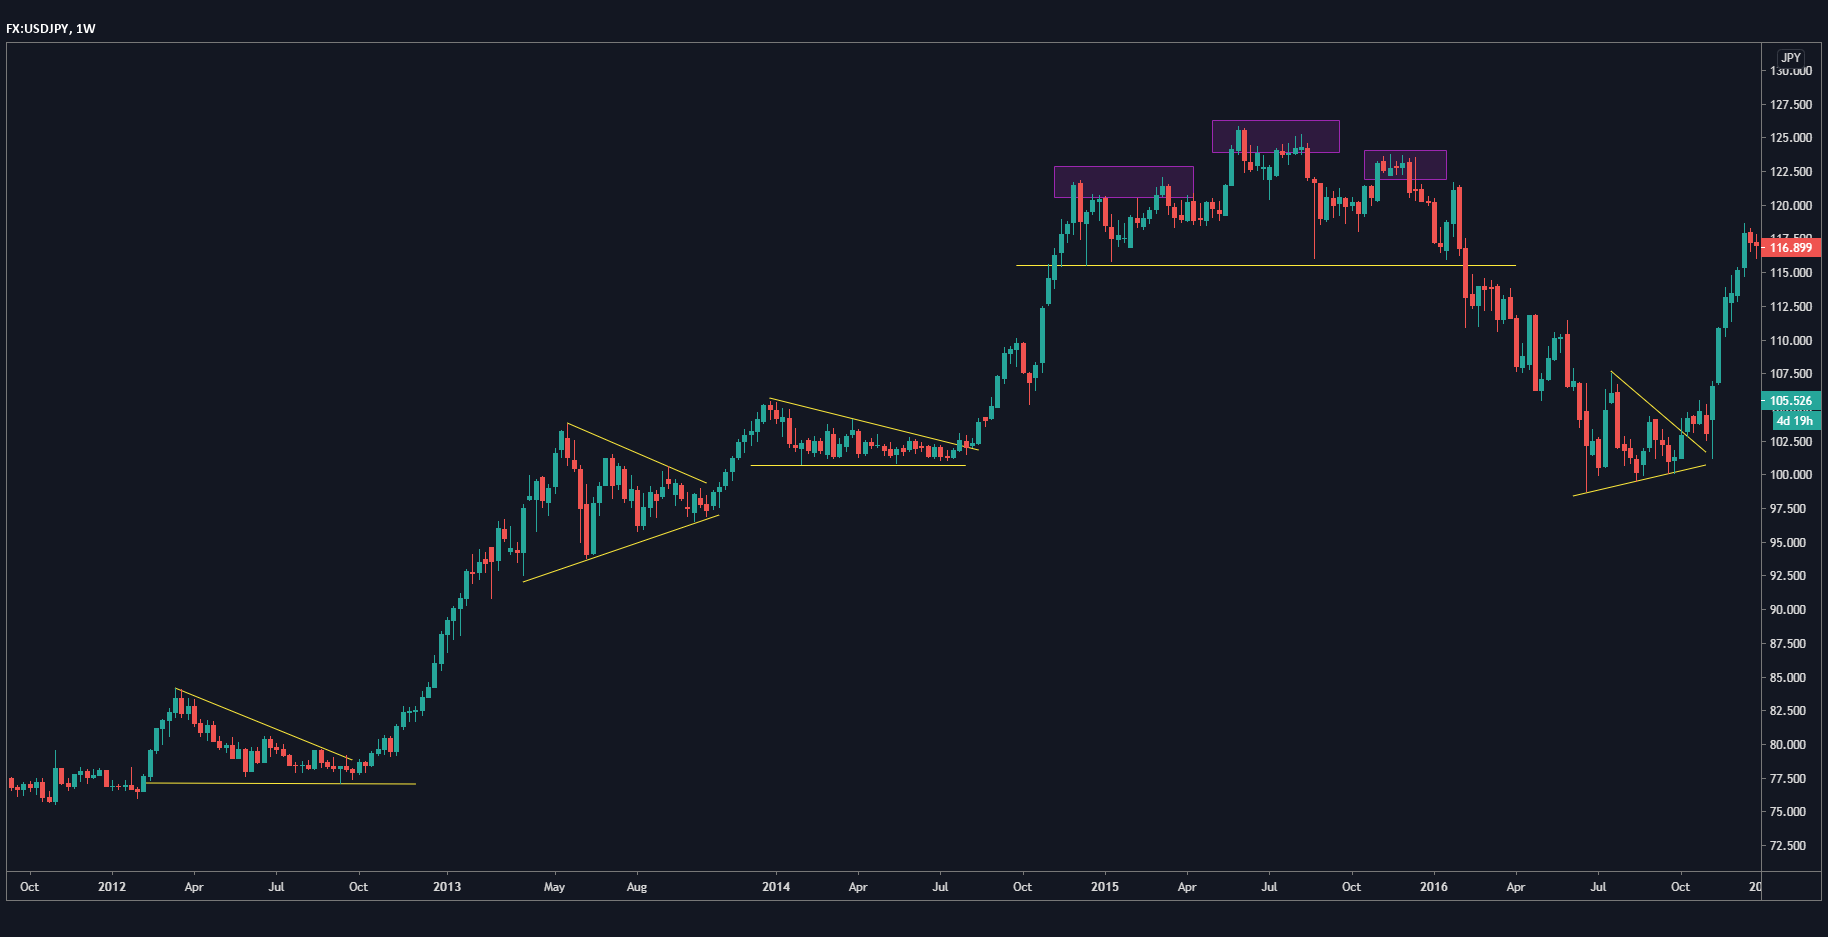
Let's look at the USD/JPY's weekly chart for another example:
You can see where I've marked a descending triangle, after which the pair broke out to the upside in a bullish trend. It then formed a symmetrical triangle and again broke out to the upside. In such a case, that triangle is no longer a reversal, but a continuation of the same trend.
The uptrend is followed by yet another triangle, which breaks out to the upside for a third time and then forms a head and shoulders bearish reversal pattern. The neckline is clean and flat, which the price breaks through to form a bearish trend reversal. On the right of the chart, there is another symmetrical triangle. Unlike the first symmetrical triangle, which continued the uptrend, this symmetrical triangle is reversing the bearish trend.
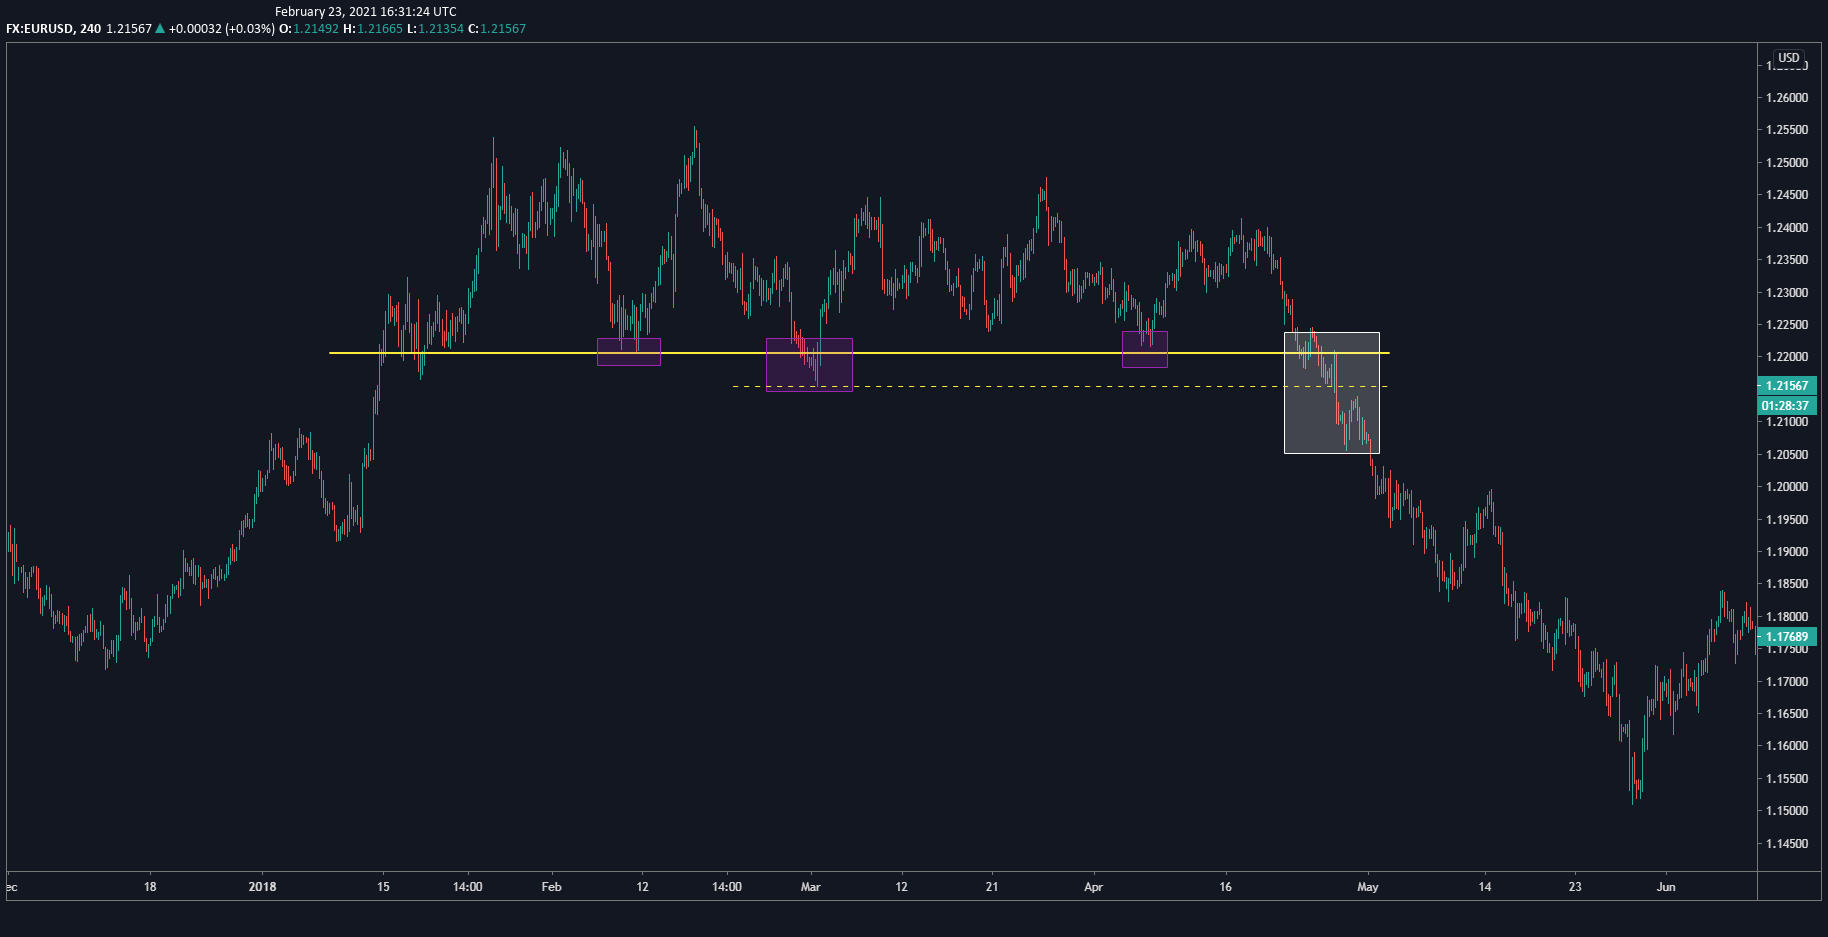
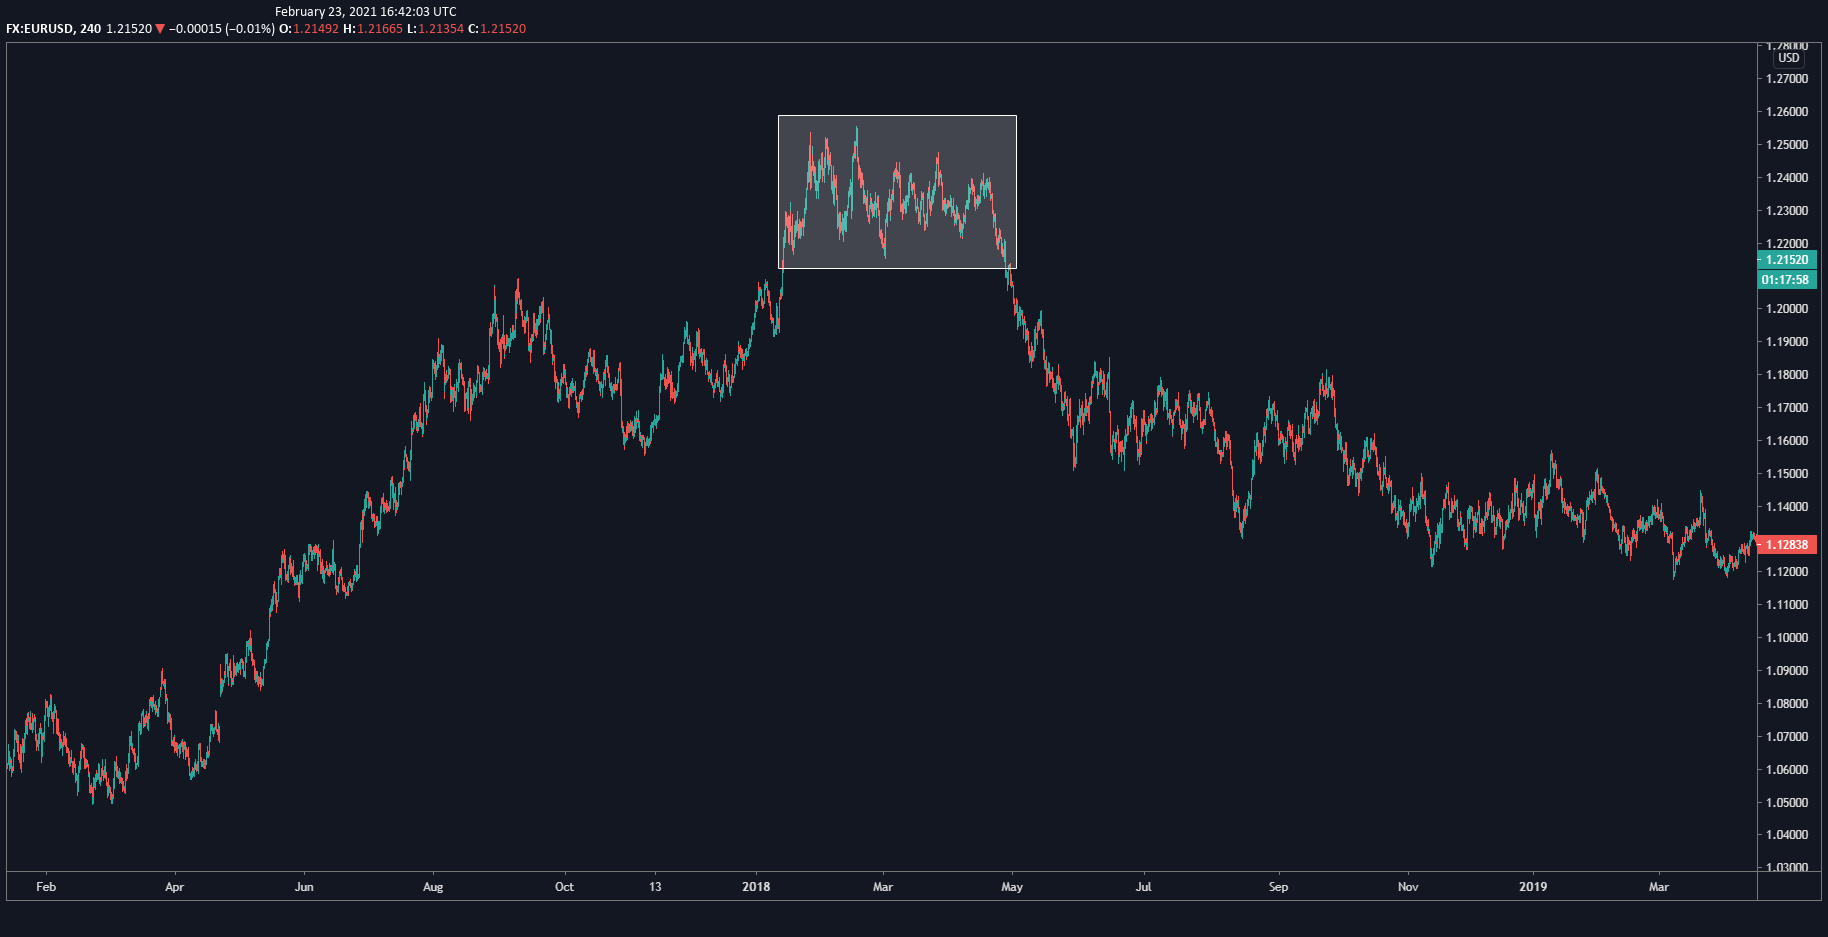
This is the EUR/USD on the four-hour chart:
The chart shows how there was a bullish, upward trend which peaked in a reversal and then plummeted in a bearish trend. The reversal has multiple peaks and went on for some weeks. Typically, that kind of dragged-out pattern results in a trend reversal.
Let's look closer at that reversal pattern:
I've drawn the support line which was touched multiple times and then broken through. When the price breaks through, it then reaches up to touch the level as resistance, and then goes back down. Whenever you have that kind of role reversal, it confirms the direction.
Another interesting thing about this pattern is that it also formed a wedge:
The pair breaks cleanly through the wedge and reaches back up to test the bottom of the wedge as resistance.
The point is, there were a number of signs here to tell you that the price would be falling down and to expect a bearish reversal.
Keep in mind that higher timeframes will always dominate lower timeframes. If you have, say, a bullish reversal on a lower timeframe, but the trend on the higher timeframe is still bearish, you can expect that the trend will remain bearish and not reverse. So always look at your reversal patterns in the context of what is happening in the higher timeframes.
I consider higher timeframes to be the four-hour and above, and the lower timeframes the hourly and below. I use the higher timeframes for my analyses, and the lower timeframes for the execution of the trade.
If you're looking for any general market analyses or economic calendars, I recommend using Exness.com.
Some general final thoughts:
If a chart isn't clear, stay away from it. Either trade a different timeframe or a different pair, but it's not worth the loss just because the chart seems inaccurate.
Lastly, always mind your risk. Make sure to set stop losses and to set your rewards equal to your risk, if not greater.

