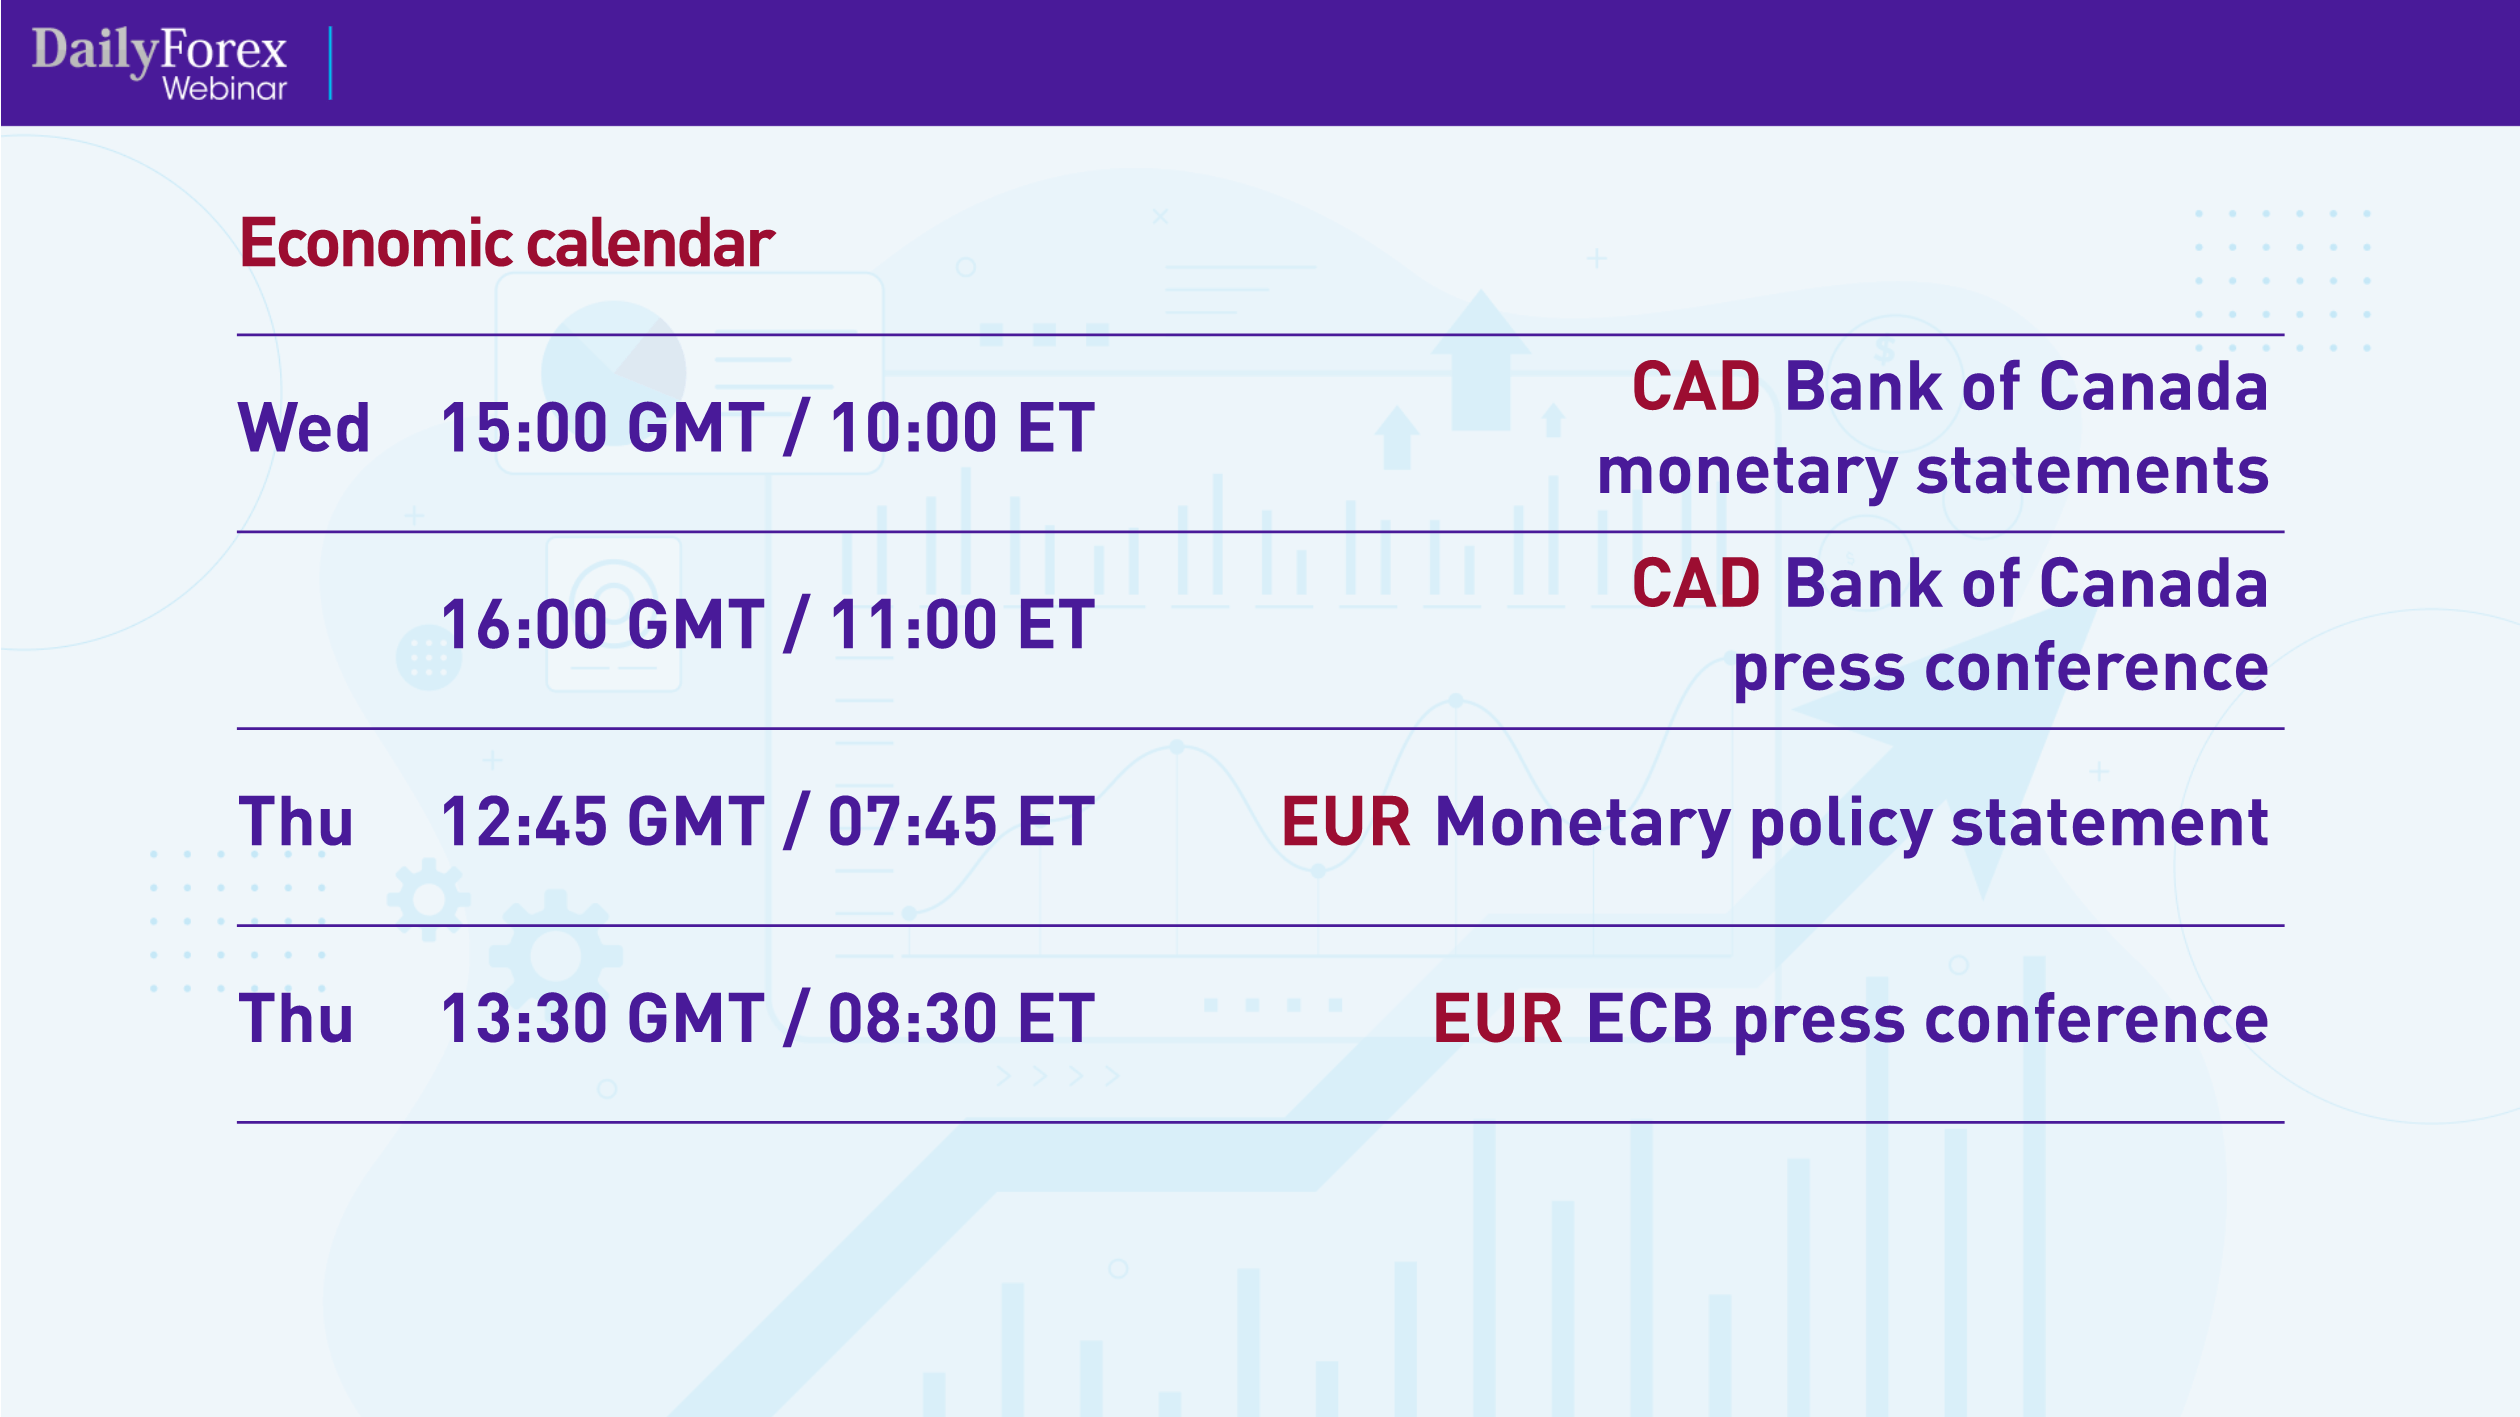
The first thing I recommend doing when conducting a weekly market analysis is looking at the economic calendar. While I don't interpret the economic data or rely too heavily on them for my trade executions, it's important to note that economic announcements add liquidity to the markets and help drive trends. Once you've looked at the economic calendar, you can better understand the market outlook and then look at price charts to figure out where to enter your trades.
Let's look at this week's economic calendar:
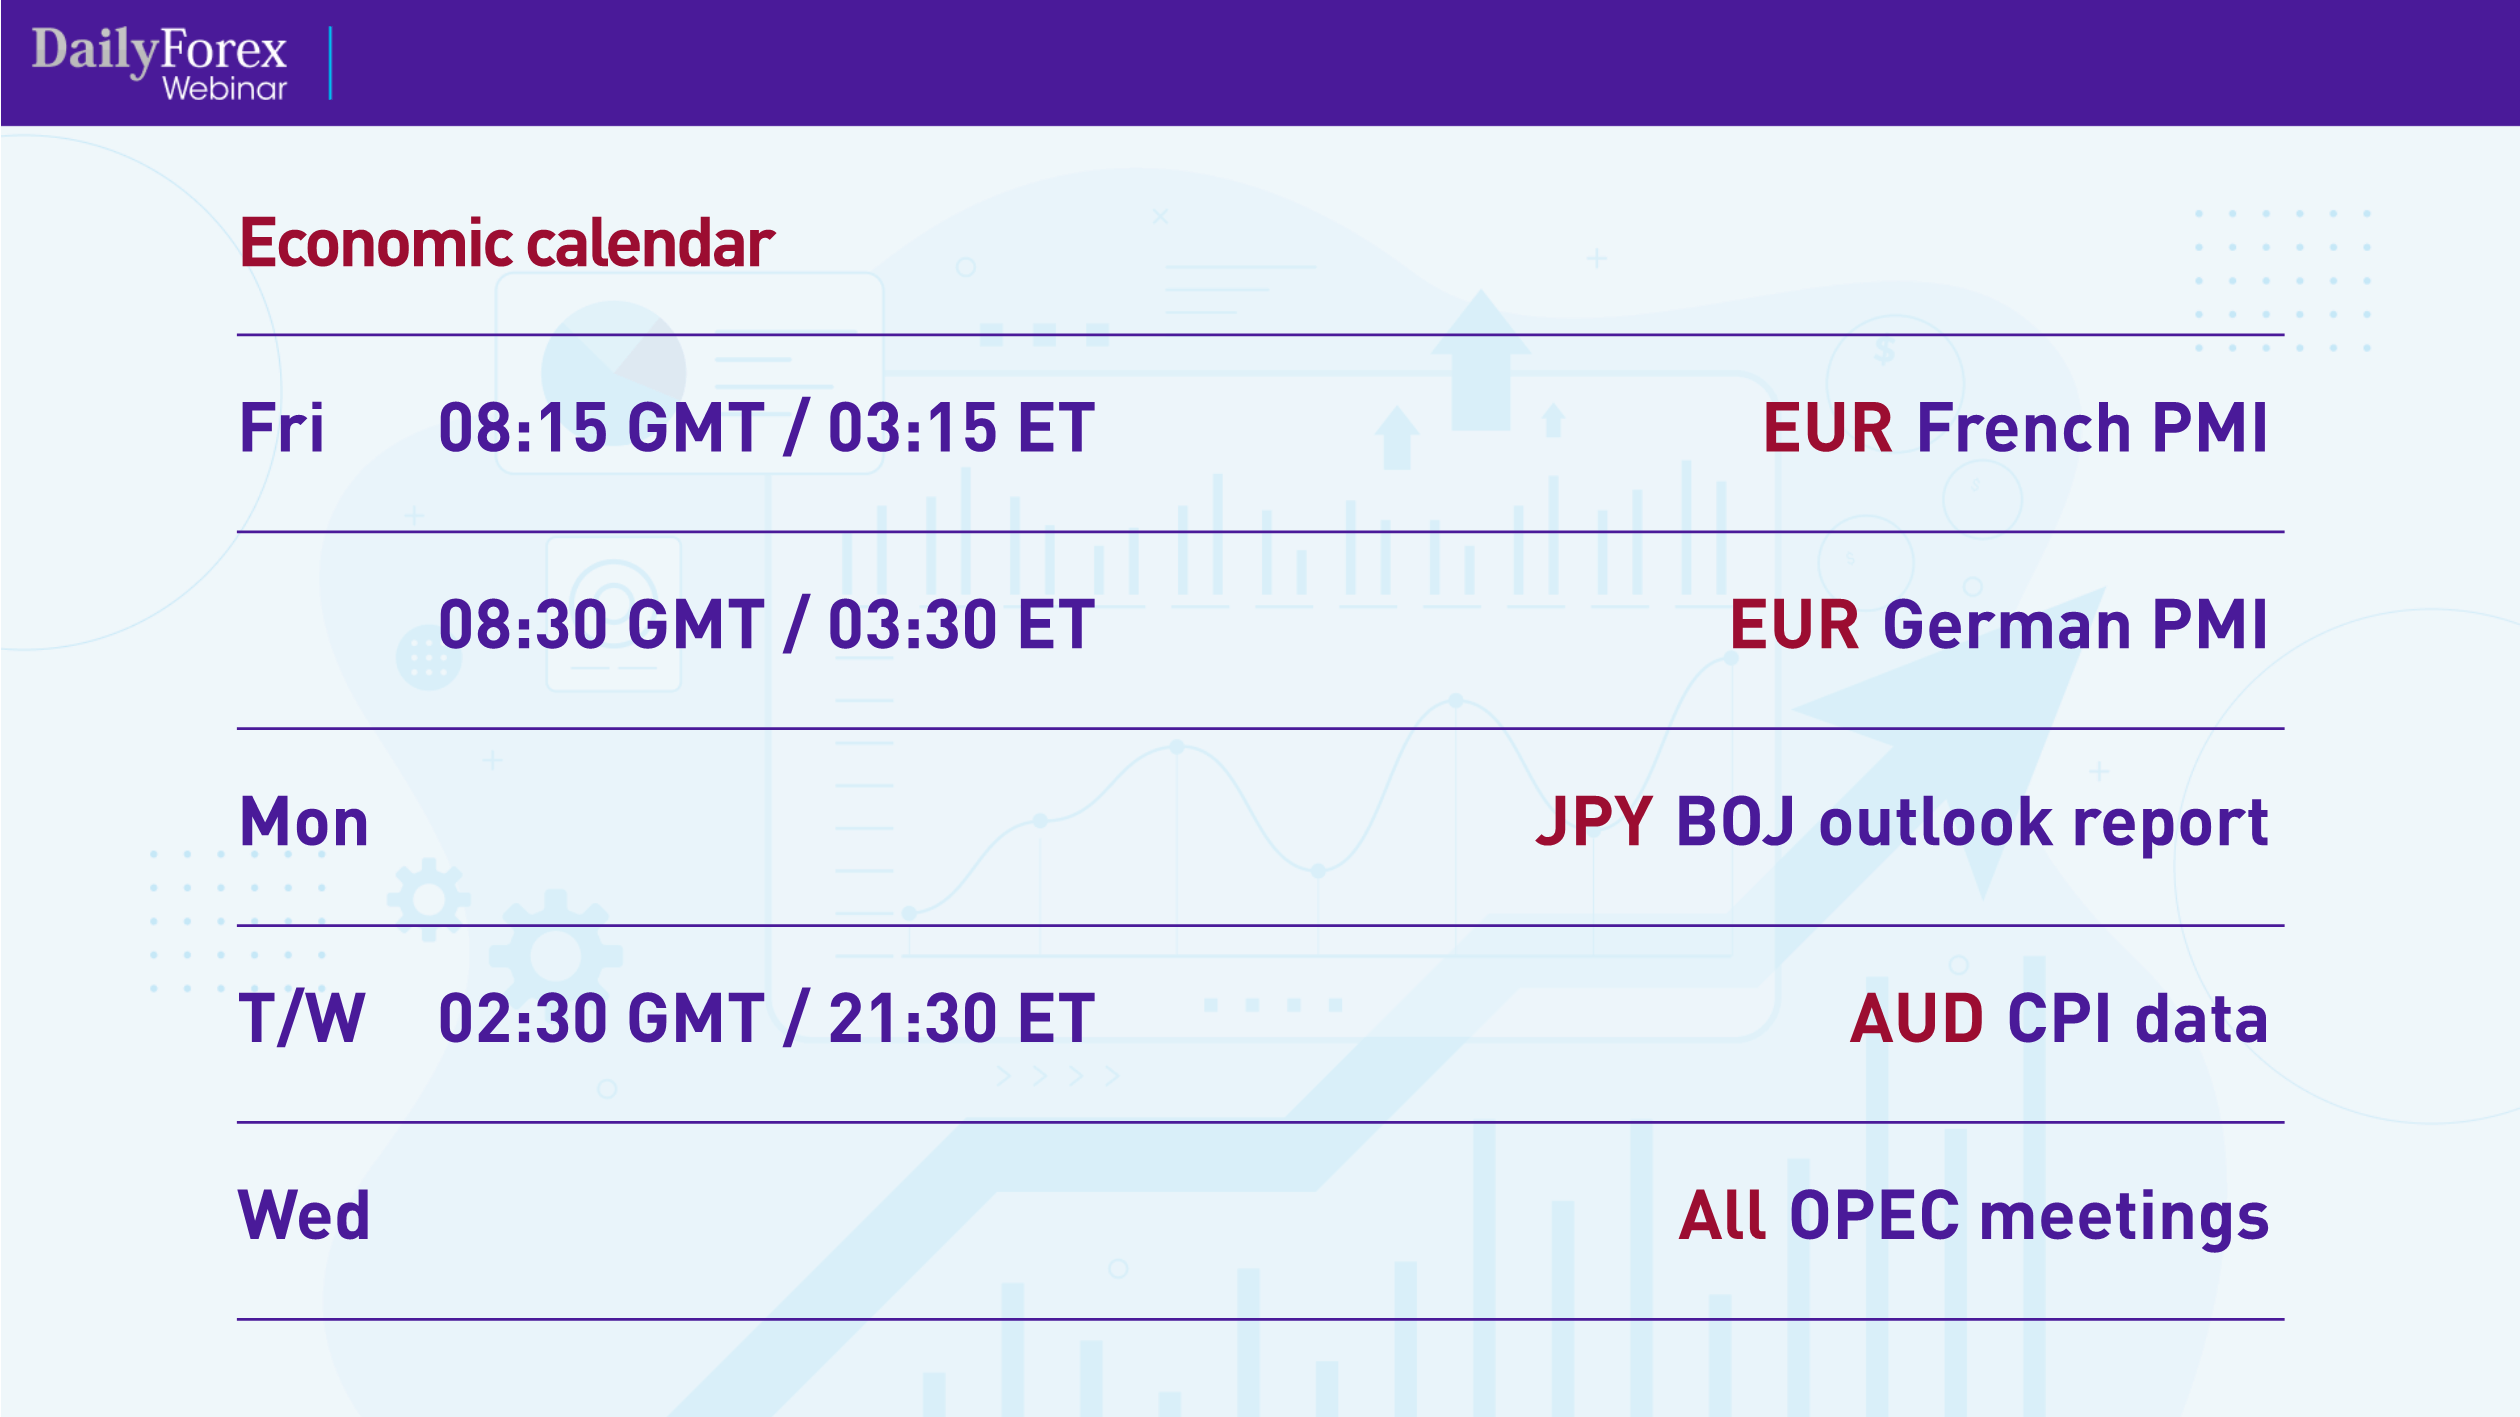
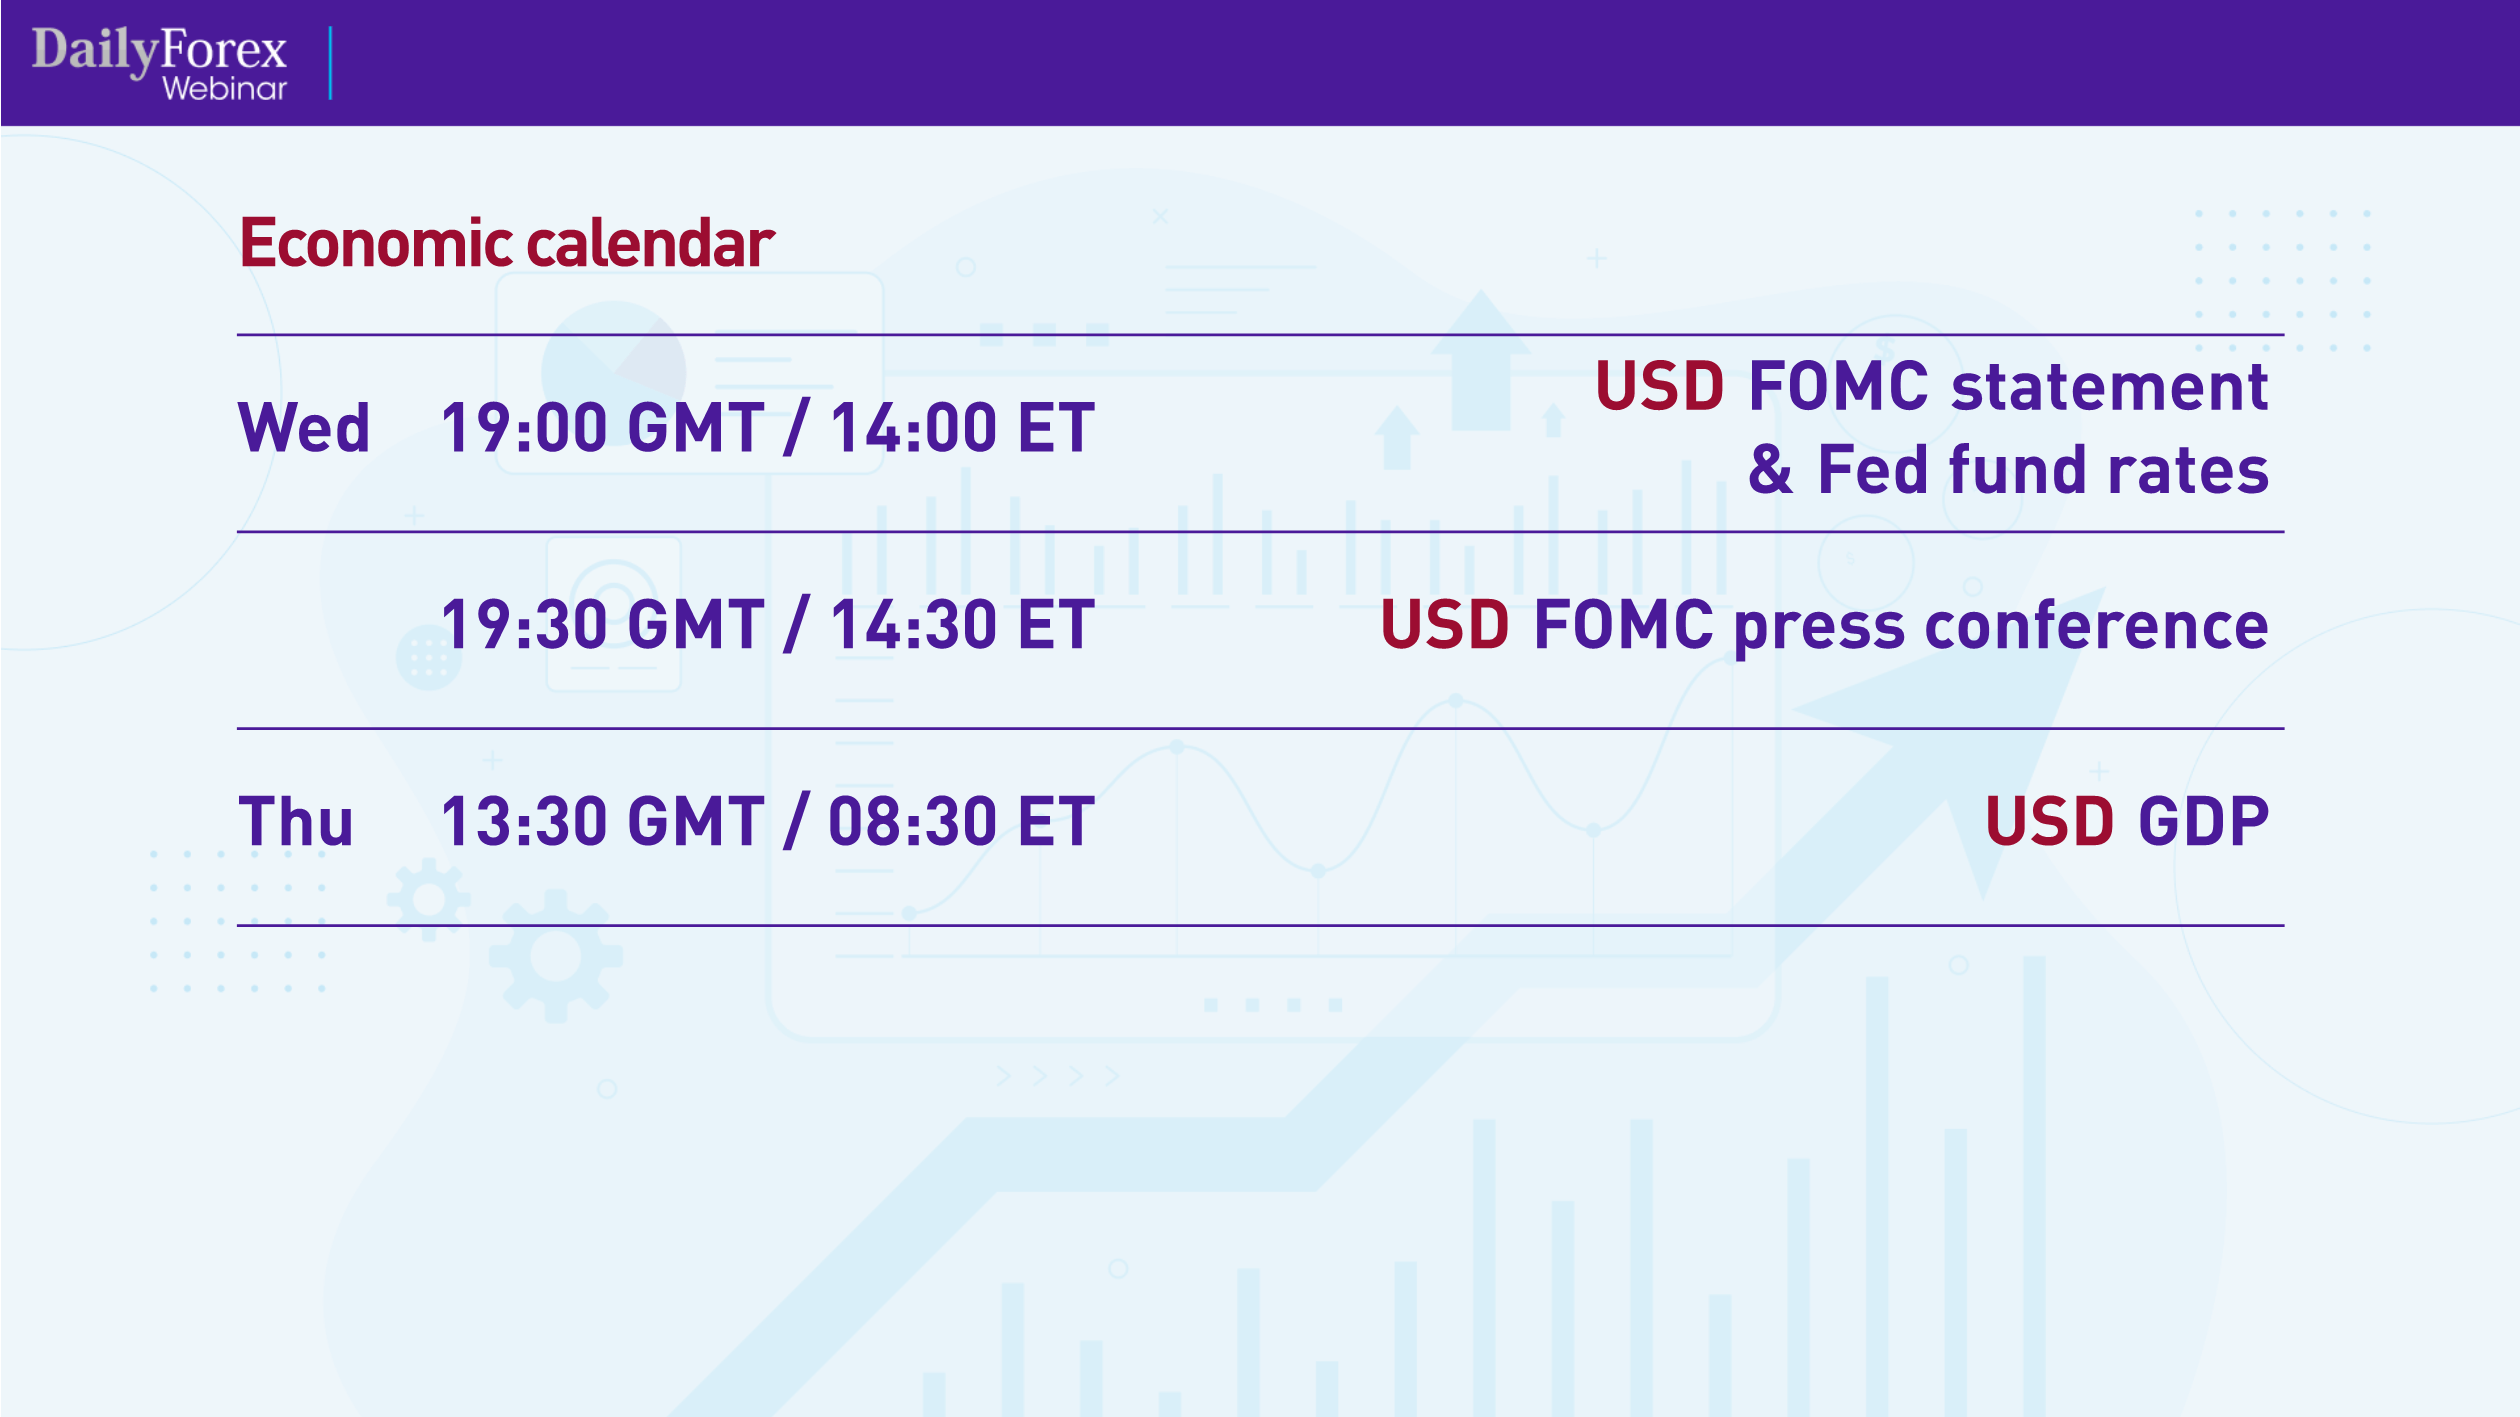 Another great way to see what's happening in the markets is by reading Forex signals. You can find Adam Lemon's free Forex signals at www.DailyForex.com, at the top right of the page.
Before we get into the price charts, I want to mention something about timeframes. I usually use the higher timeframes – such as the weekly, daily and four-hour charts – to study the trades and conduct my technical analysis. But for the actual trade execution, I use the lower timeframes, such as the hourly, 15-minute and 5-minute charts. (I think the 15-minute charts in particular tend to give you some tight entries.)
It's important to trade with a Forex broker that will provide you with a good trading platform and adequate resources so that you can access these timeframes, like Markets.com.
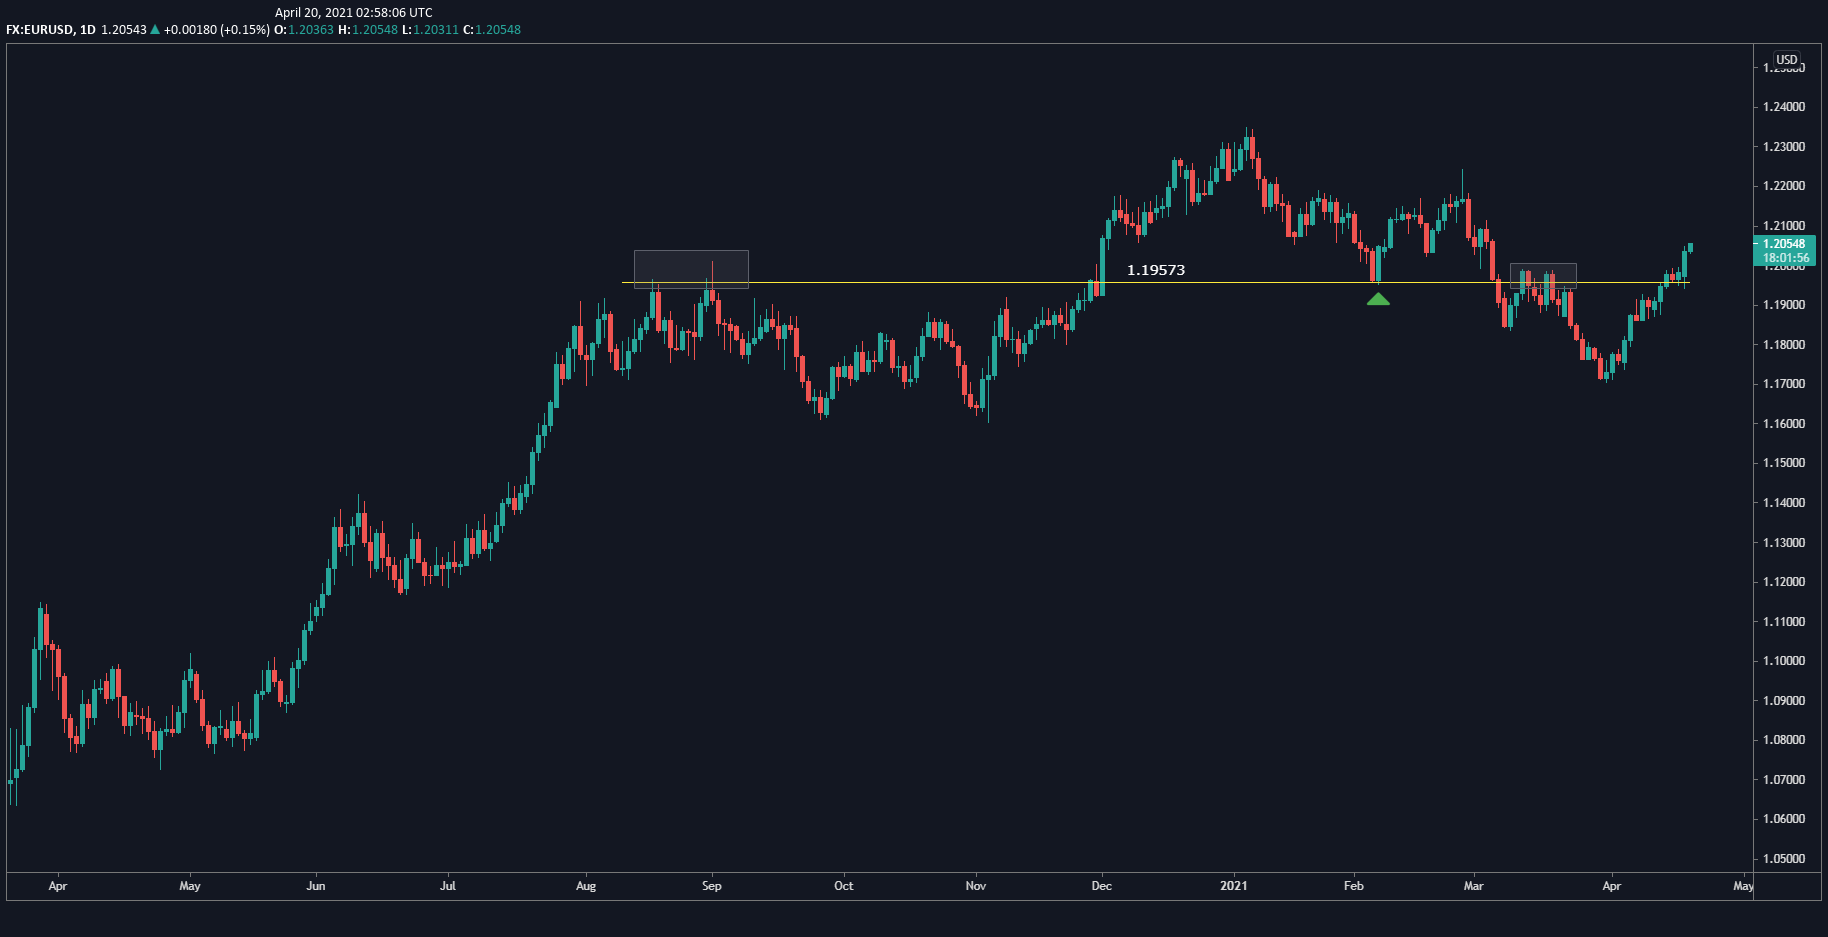
Let's begin our market analysis by taking a look at the daily chart for the EUR/USD currency pair:
The EUR/USD has been in a bit of an uptrend. I marked the key level at 1.1957 where the price stalled back in August of 2020, then decisively broke through it as you can see on the chart. The price then came down to touch the level, and I thought the level was going to hold. However, the price stalled, had a bit of a downtrend since March, and has now reversed above that key level, which is why I'm bullish EUR/USD.
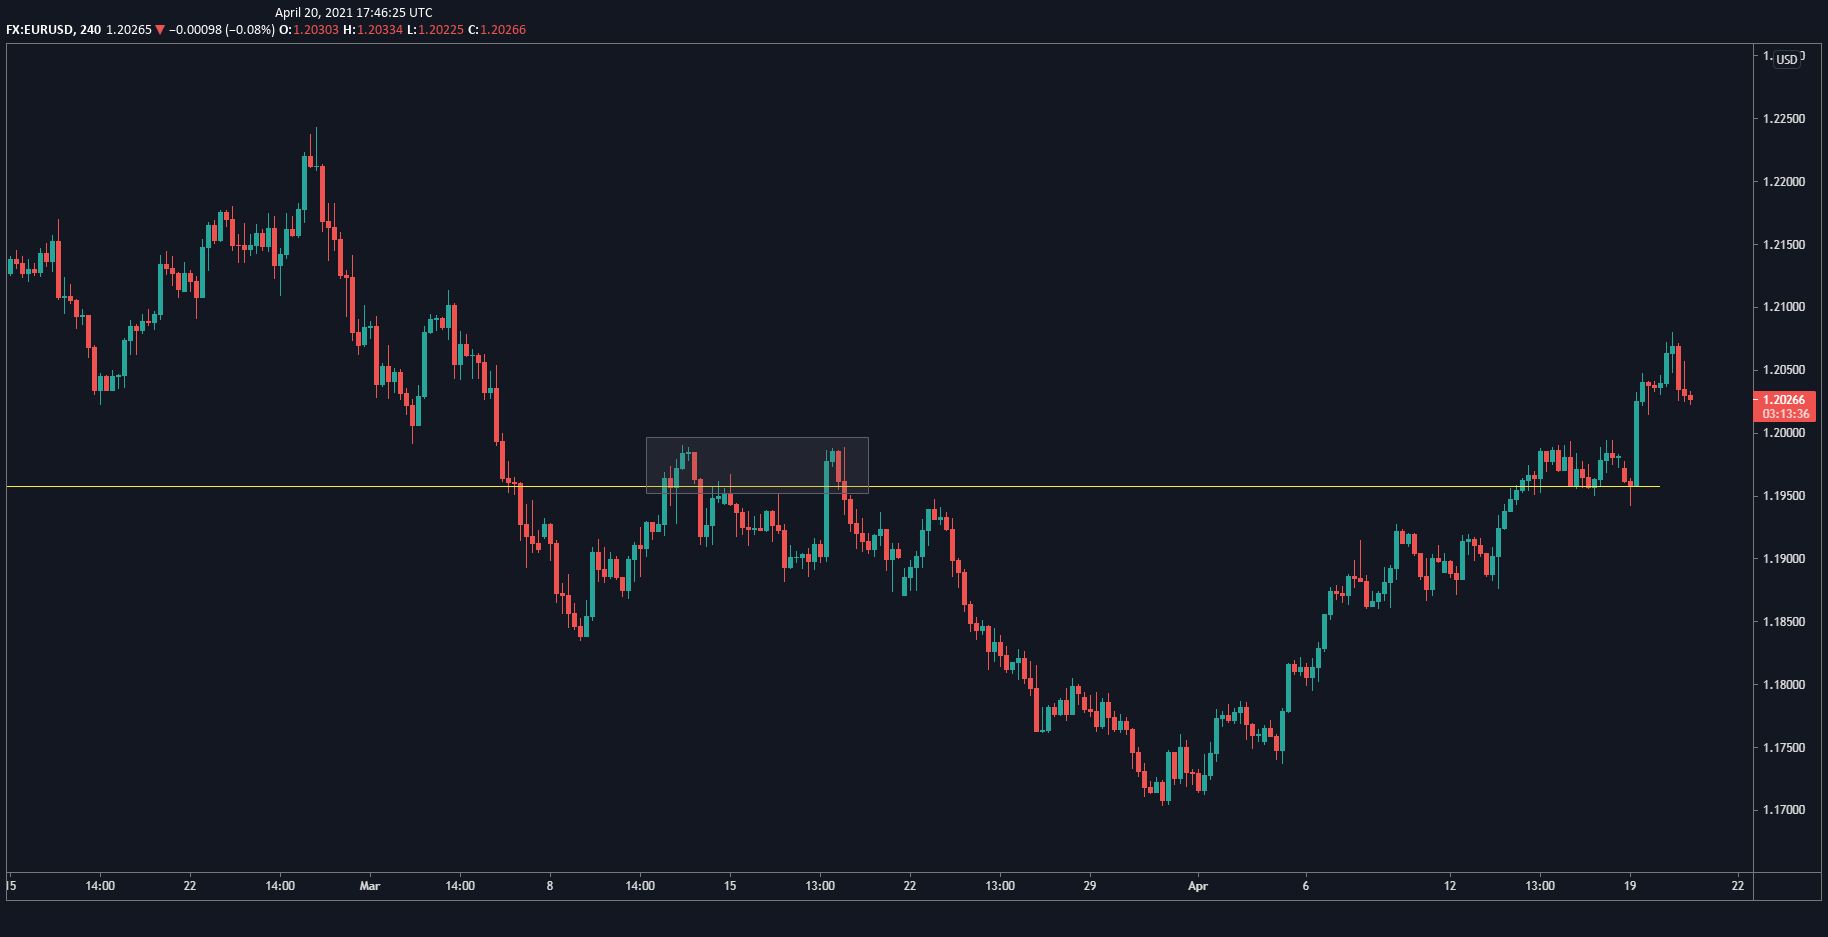
Let's look at that same level on the 4-hour chart:
You can see how decisive the price was in breaking above the level firmly, which explains my bullish stance.
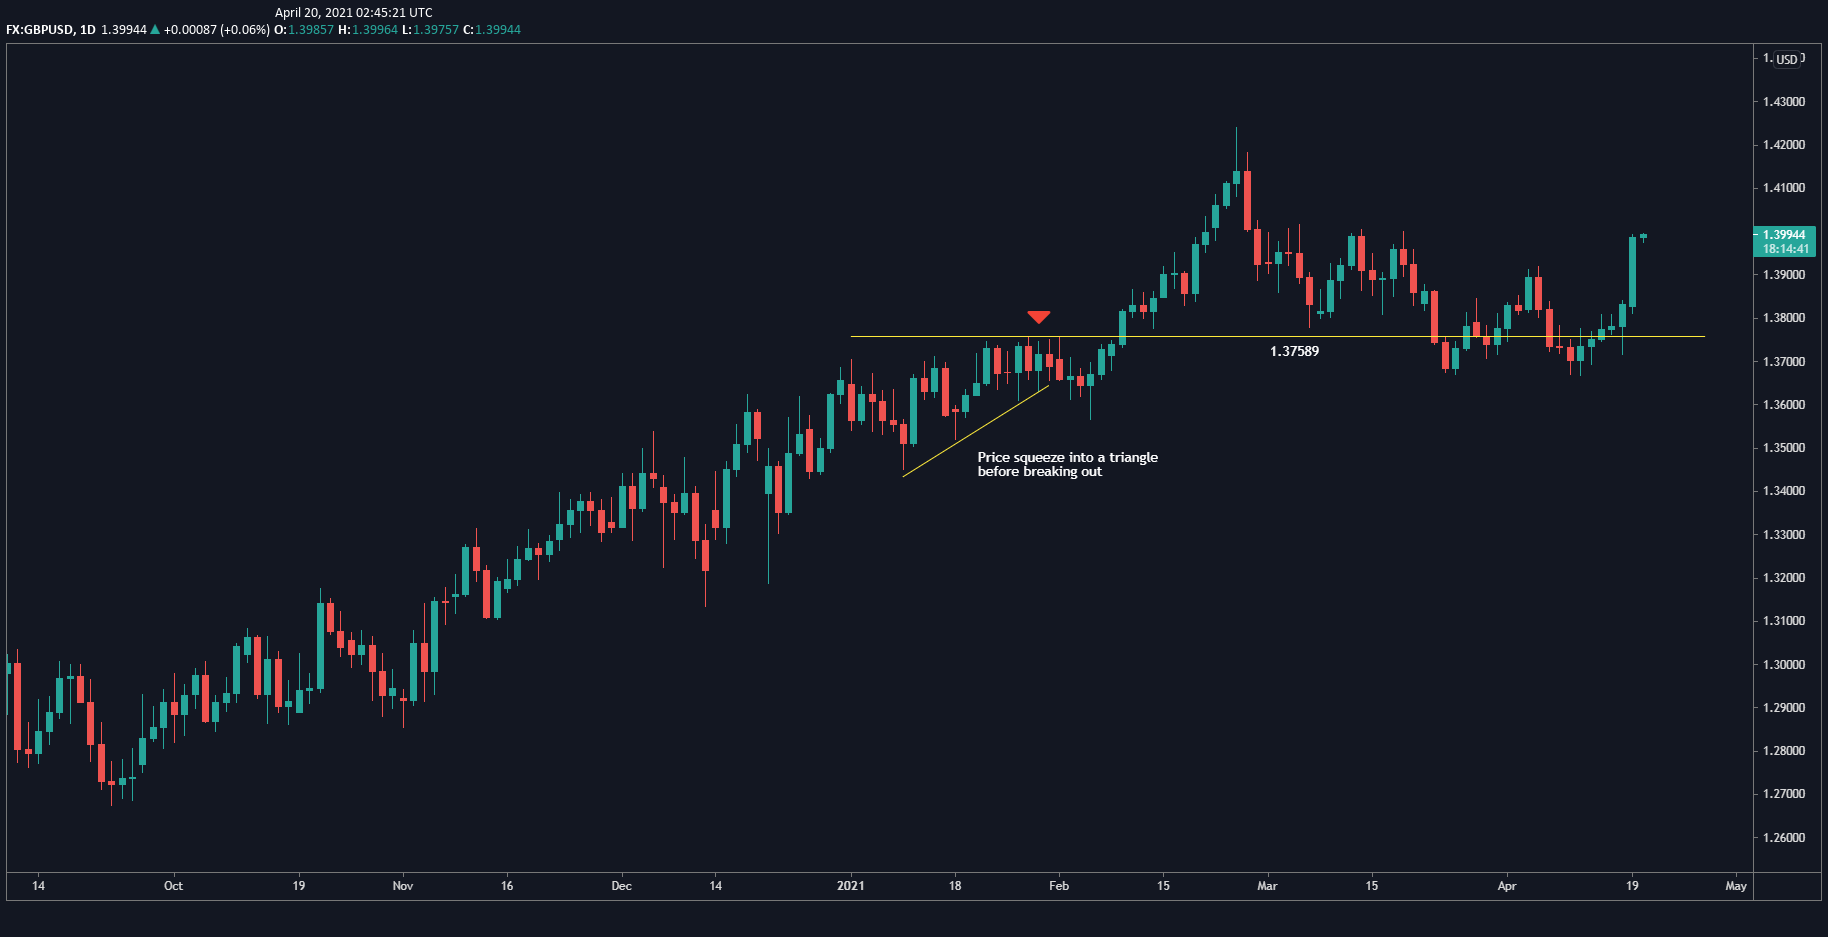
Now let's look at the daily chart for the GBP/USD:
The GBP/USD has been in an uptrend for a long time. The price squeezed around the level I marked, then popped up above it and retraced downwards. It didn't quite hold at that level, but it made a nice double bottom.
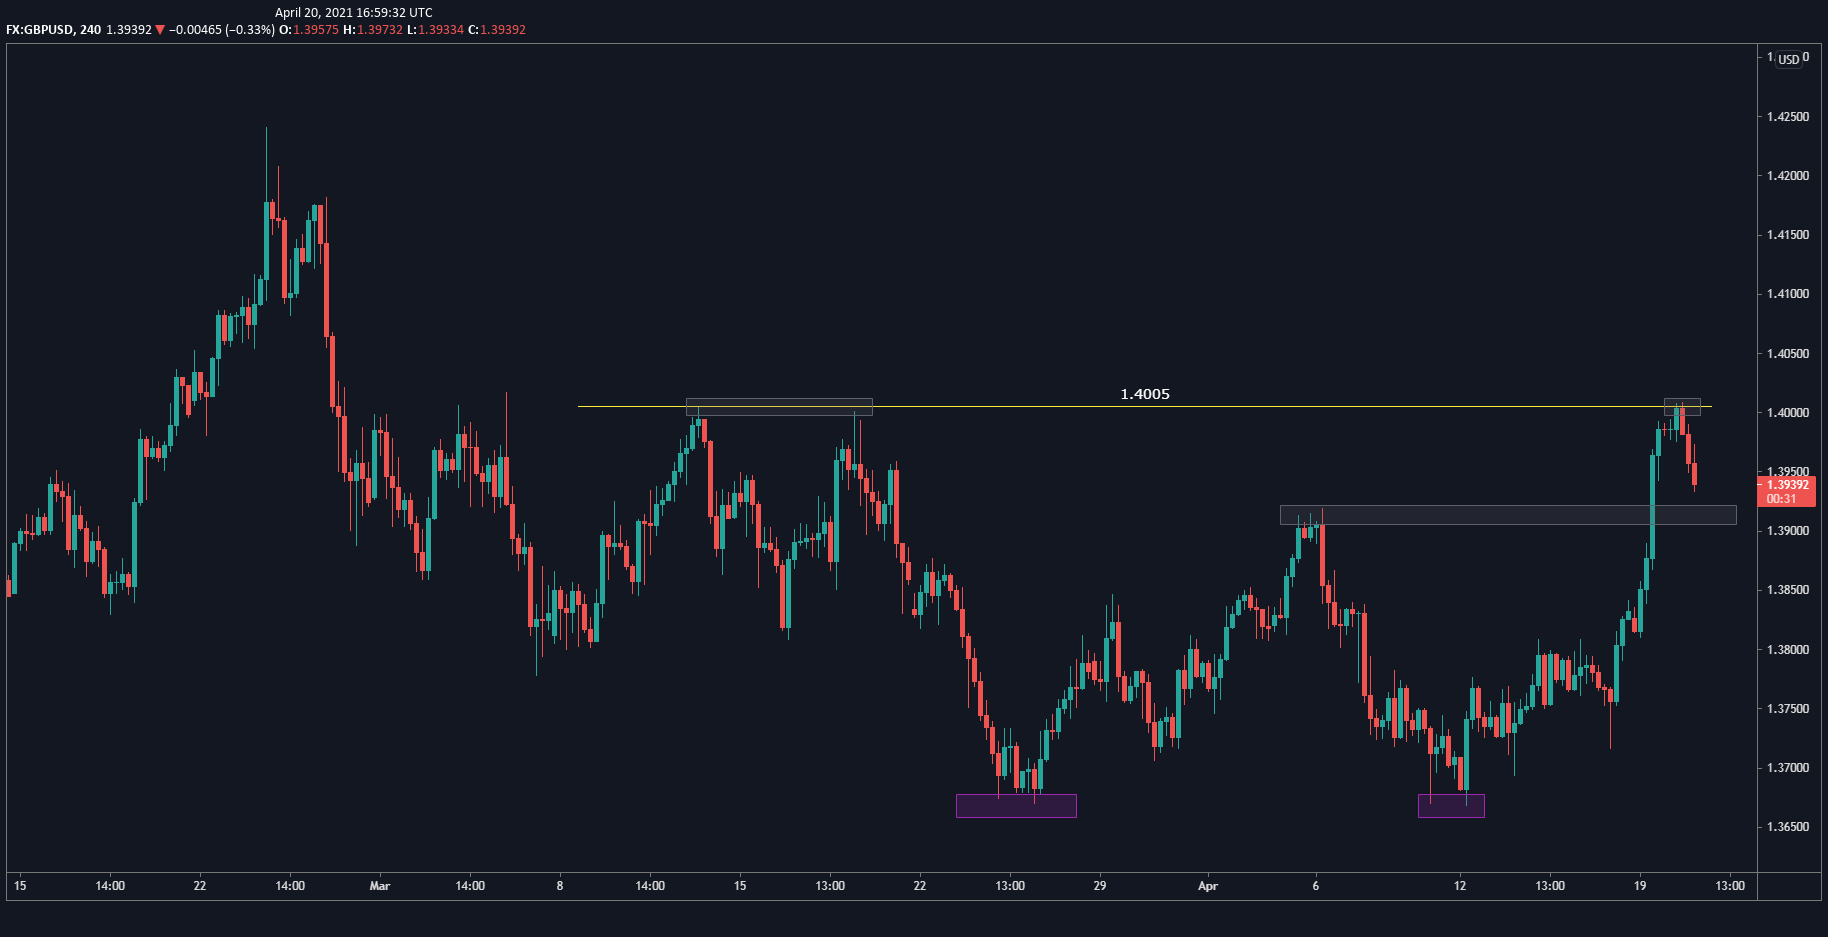
I've marked that double bottom in purple on the 4-hour chart:
The price hit a resistance level recently and has retraced downwards. However, I wouldn't get long of this pair until it reaches another 30-50 pips downwards to the grey box I've marked. So I'm bullish the GBP/USD, but I want to see it establish that base first before I jump in.
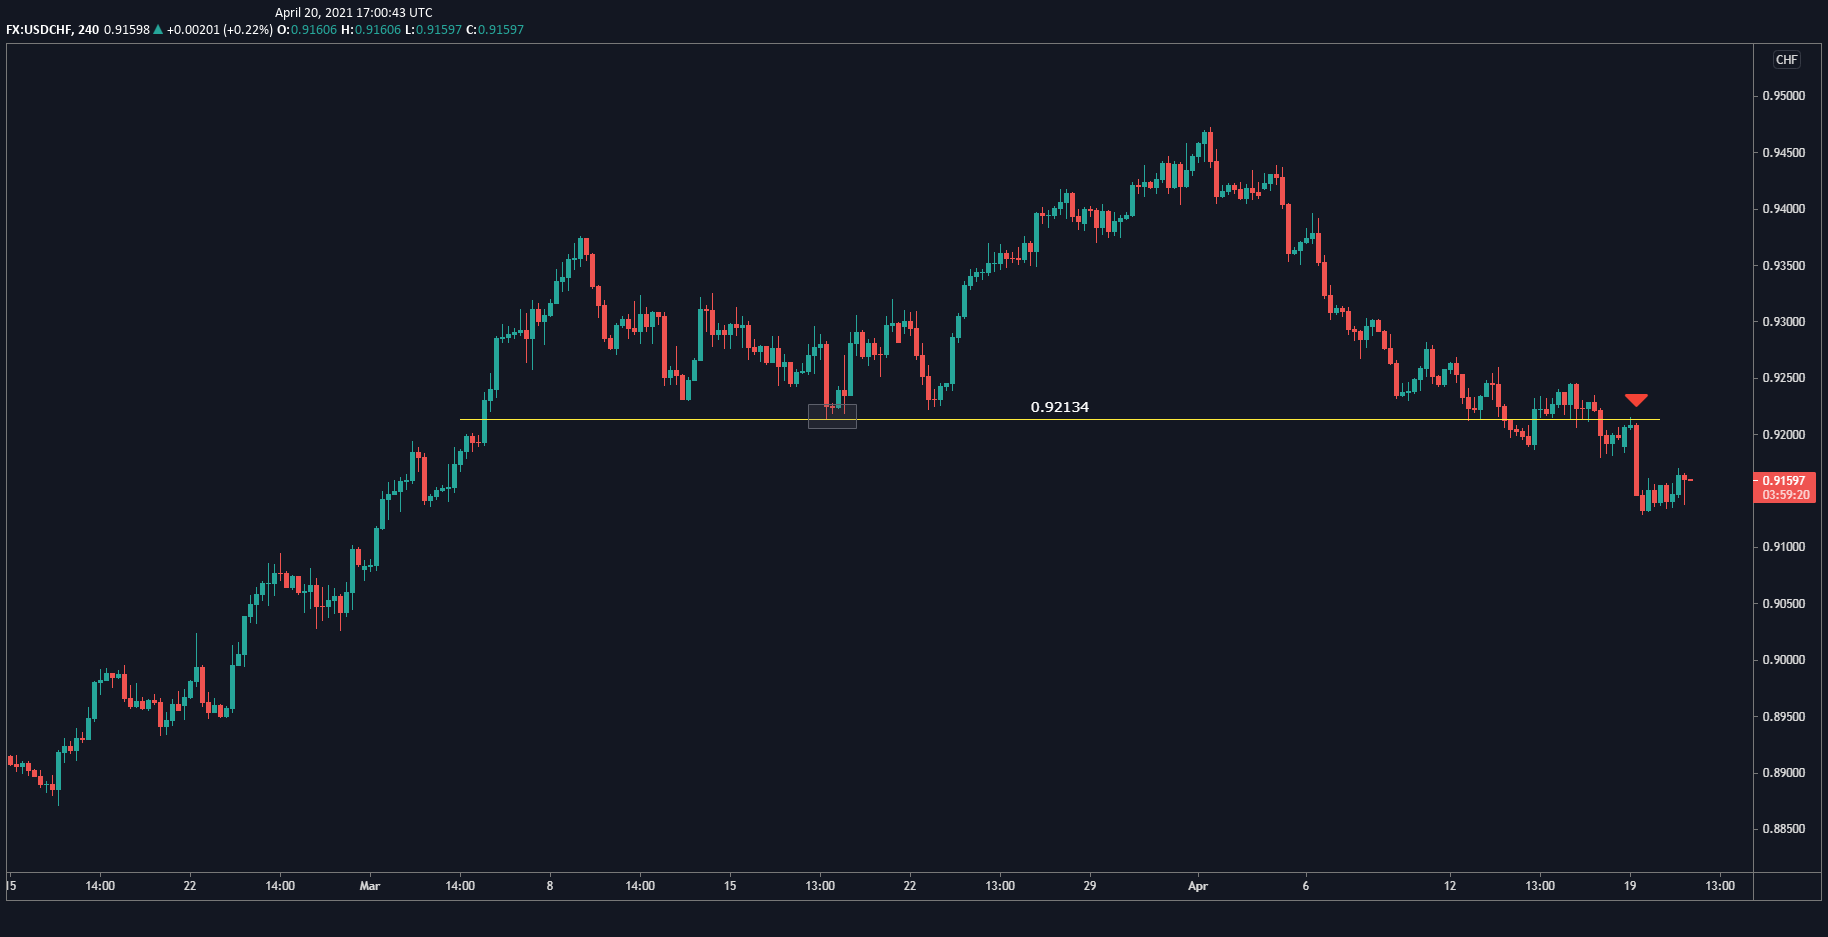
The USD/CHF is a very interesting pair, which we'll analyze using the 4-hour chart:
I've marked a grey box where the price made a support out of that key level and, after making a higher high, came down and broke through that support level. What's interesting is that the price then came back up to test the level as resistance, which I think confirms that the pair is in a downtrend. The pair seems to be making a corrective move higher, but I think we're due for another leg down, so I'm bearish USD/CHF.
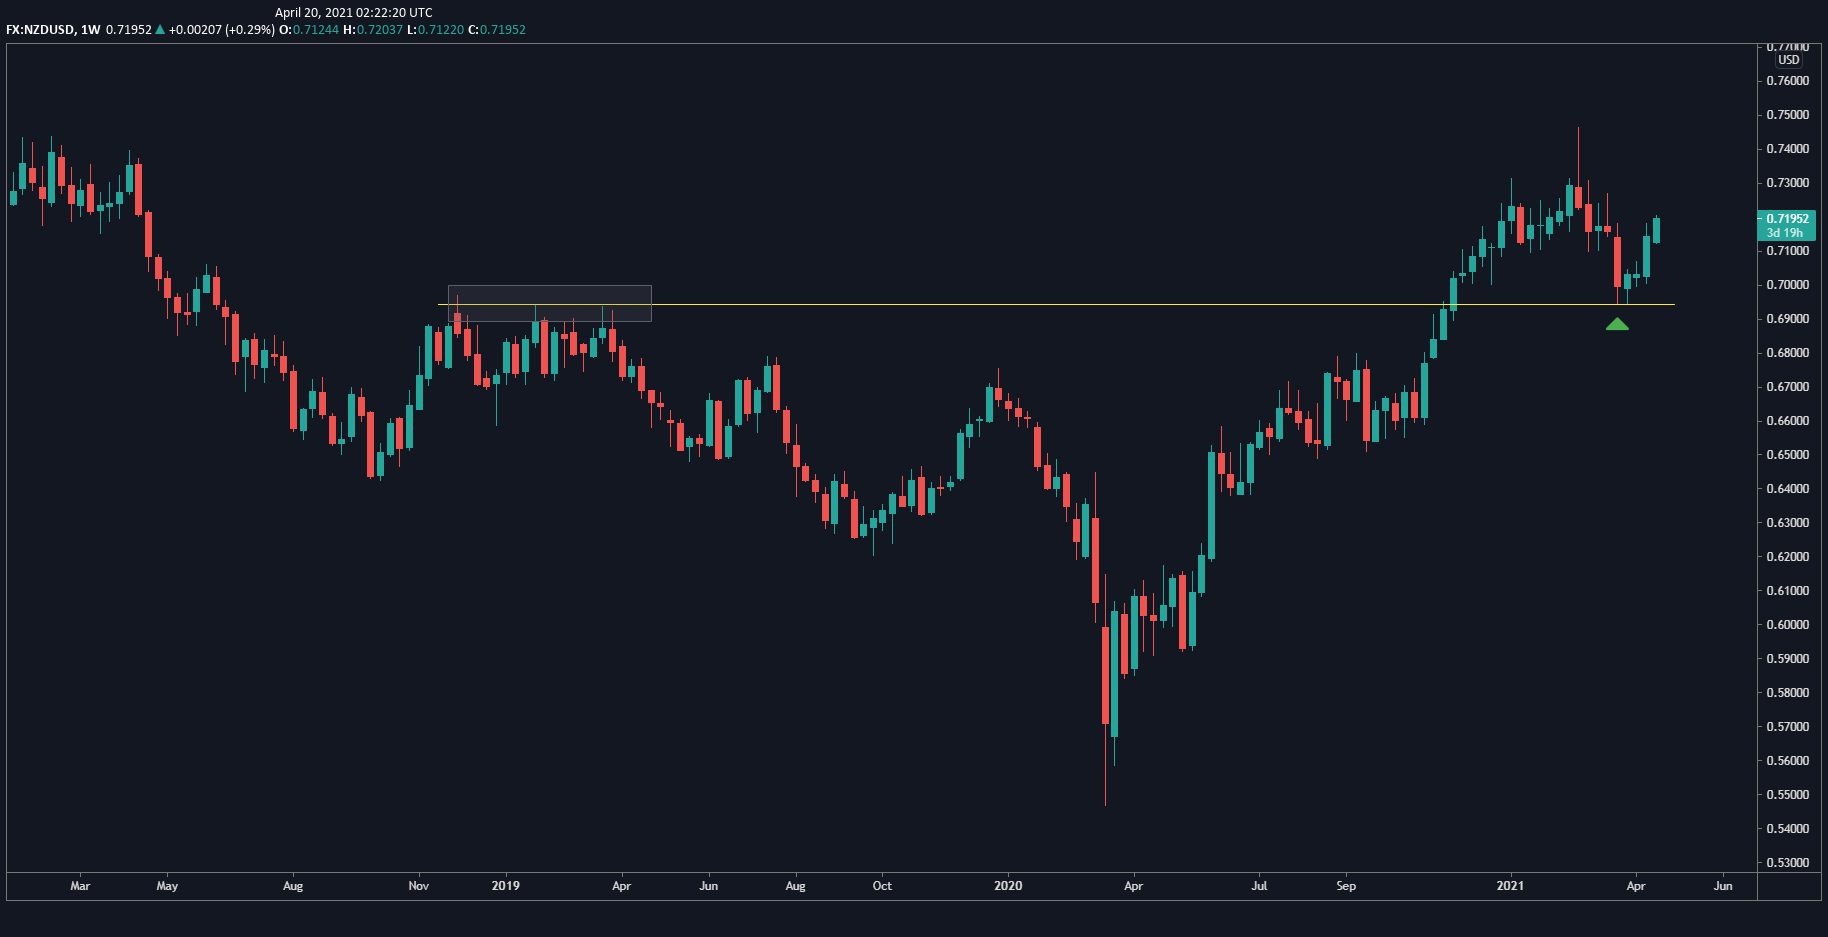
Let's now look at the weekly chart for the NZD/USD:
I'm showing you the weekly chart so you can see how the pair has really bounced against a key level. The price first touched the level back in late 2018-early 2019, then pushed down until March 2020, made a bottom, and has been trending upwards ever since. It broke through the resistance level and retraced down to test the resistance as support quite cleanly. This really confirms the uptrend, so I'm bullish NZD/USD.
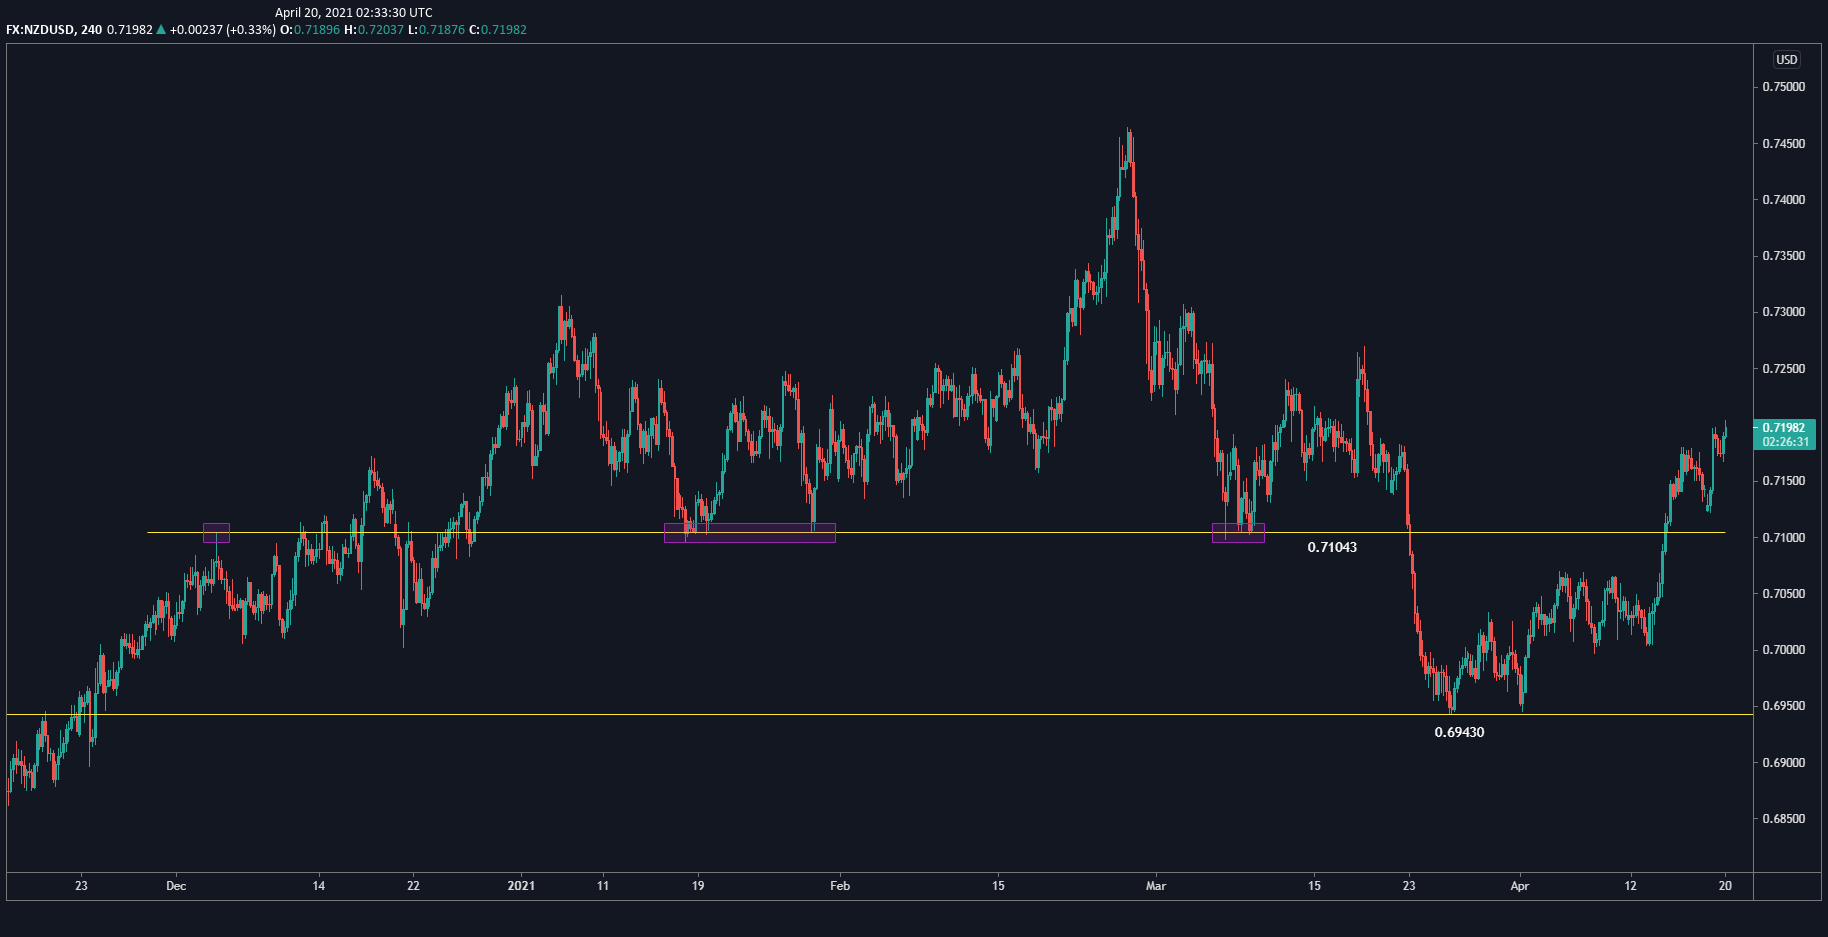
However, it gets a bit messy when you zoom in to the 4-hour chart:
The upper yellow line is where I've marked the support level that was made on the 4-hour timeframe. You can see how the price fell through it to test the previous resistance level we saw on the weekly chart as support, then broke above the previous support level.
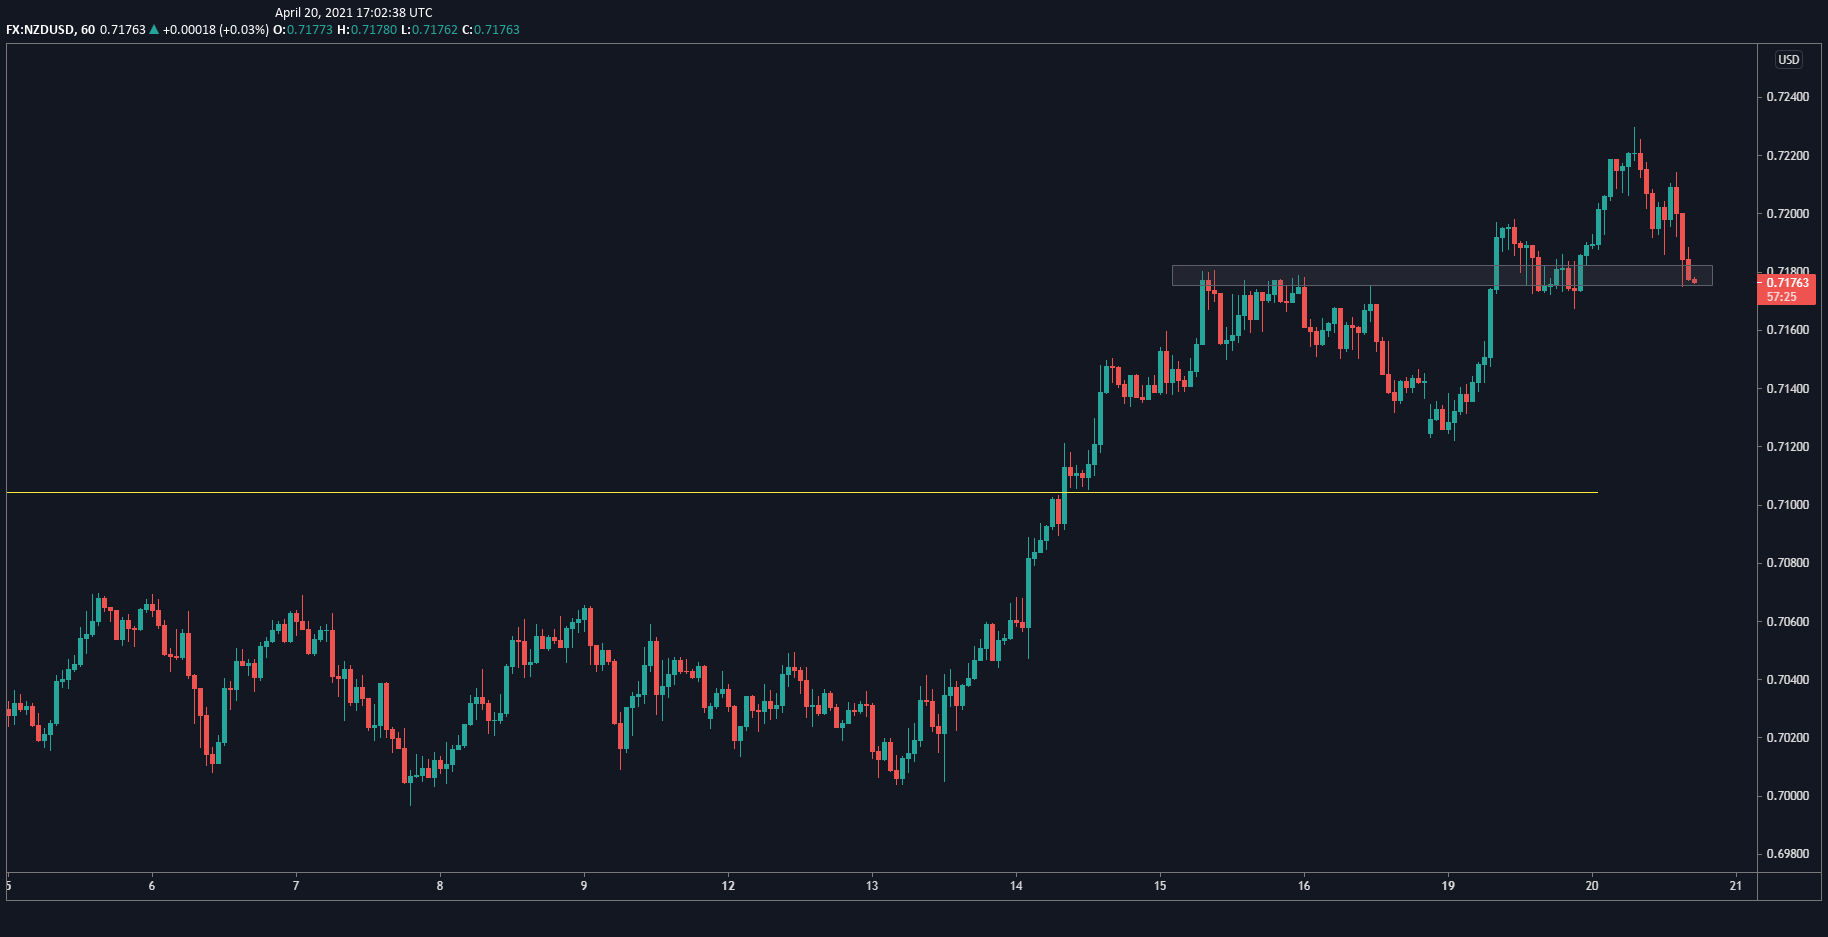
Zooming further in to the hourly chart, I think we can find an entry:
If the price stalls around the area I've marked with a grey box, I think that would be a nice bullish trade to enter.
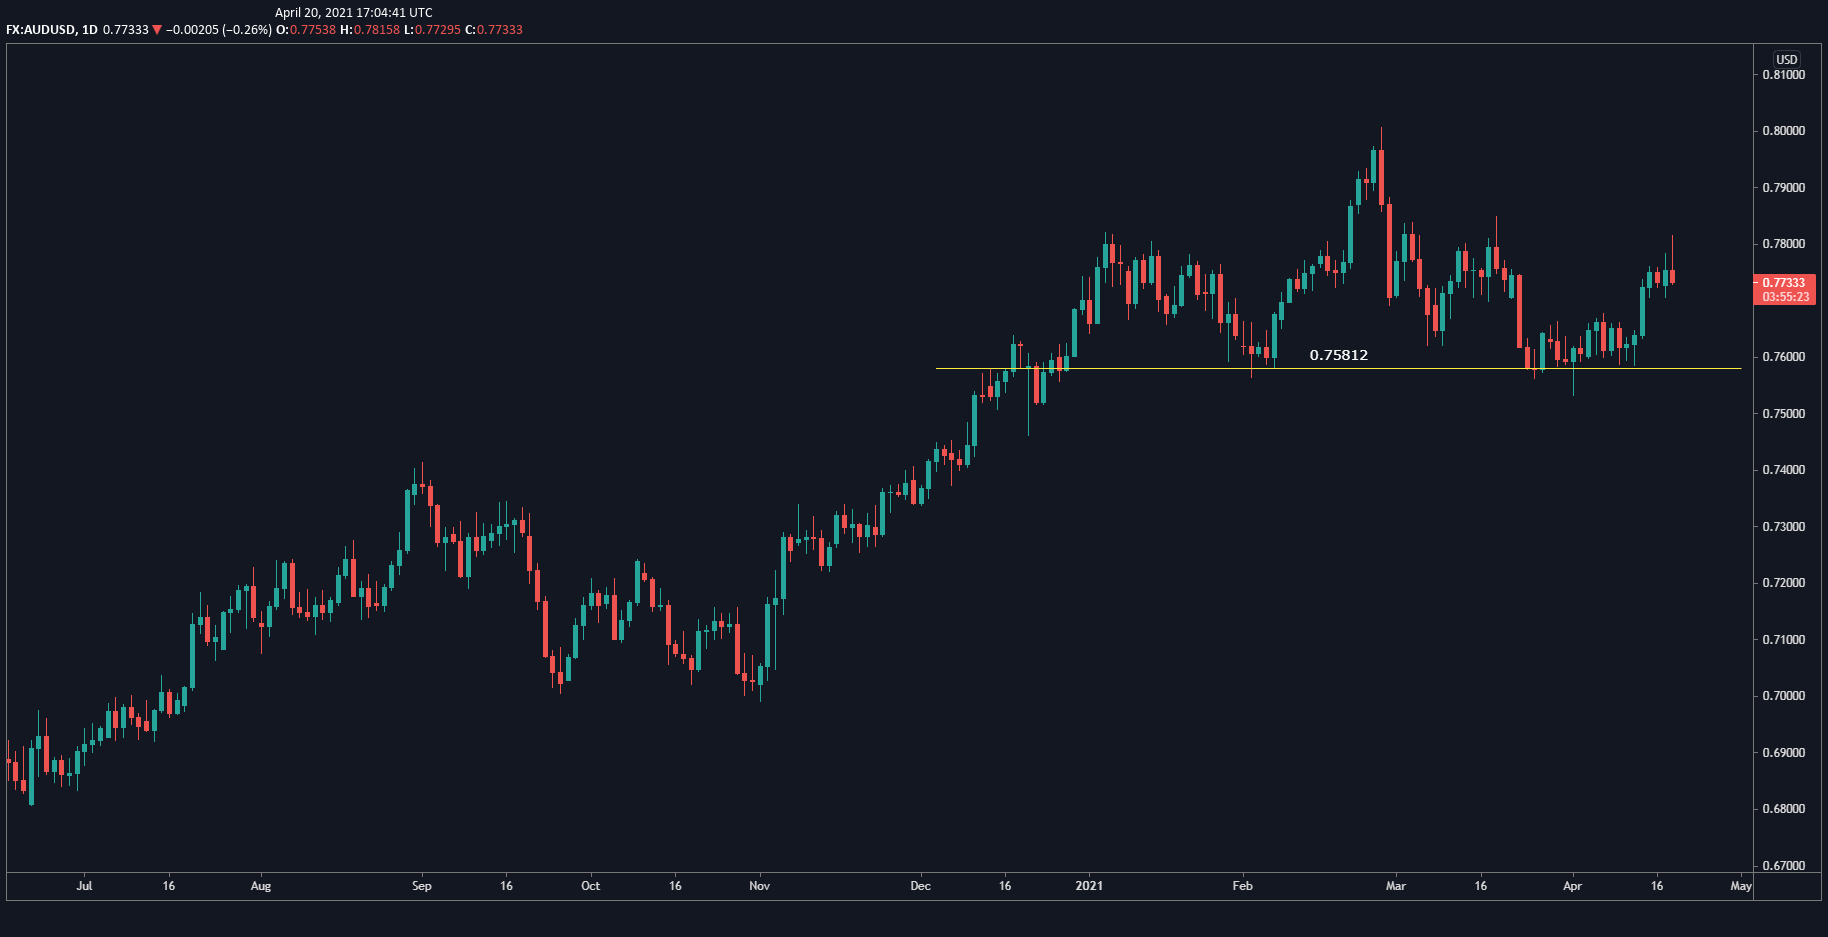
Let's look at the daily chart for the AUD/USD pair, where I've marked a key level:
I see that the price formed a head and shoulders pattern above the level marked by a yellow line, but as it never actually broke through that level, it's a failed pattern. So because it had a chance to reverse and didn't, it confirms the bullish trend. This pair may not be as strongly bullish as the NZD/USD, but I'm still generally bullish the AUD/USD.
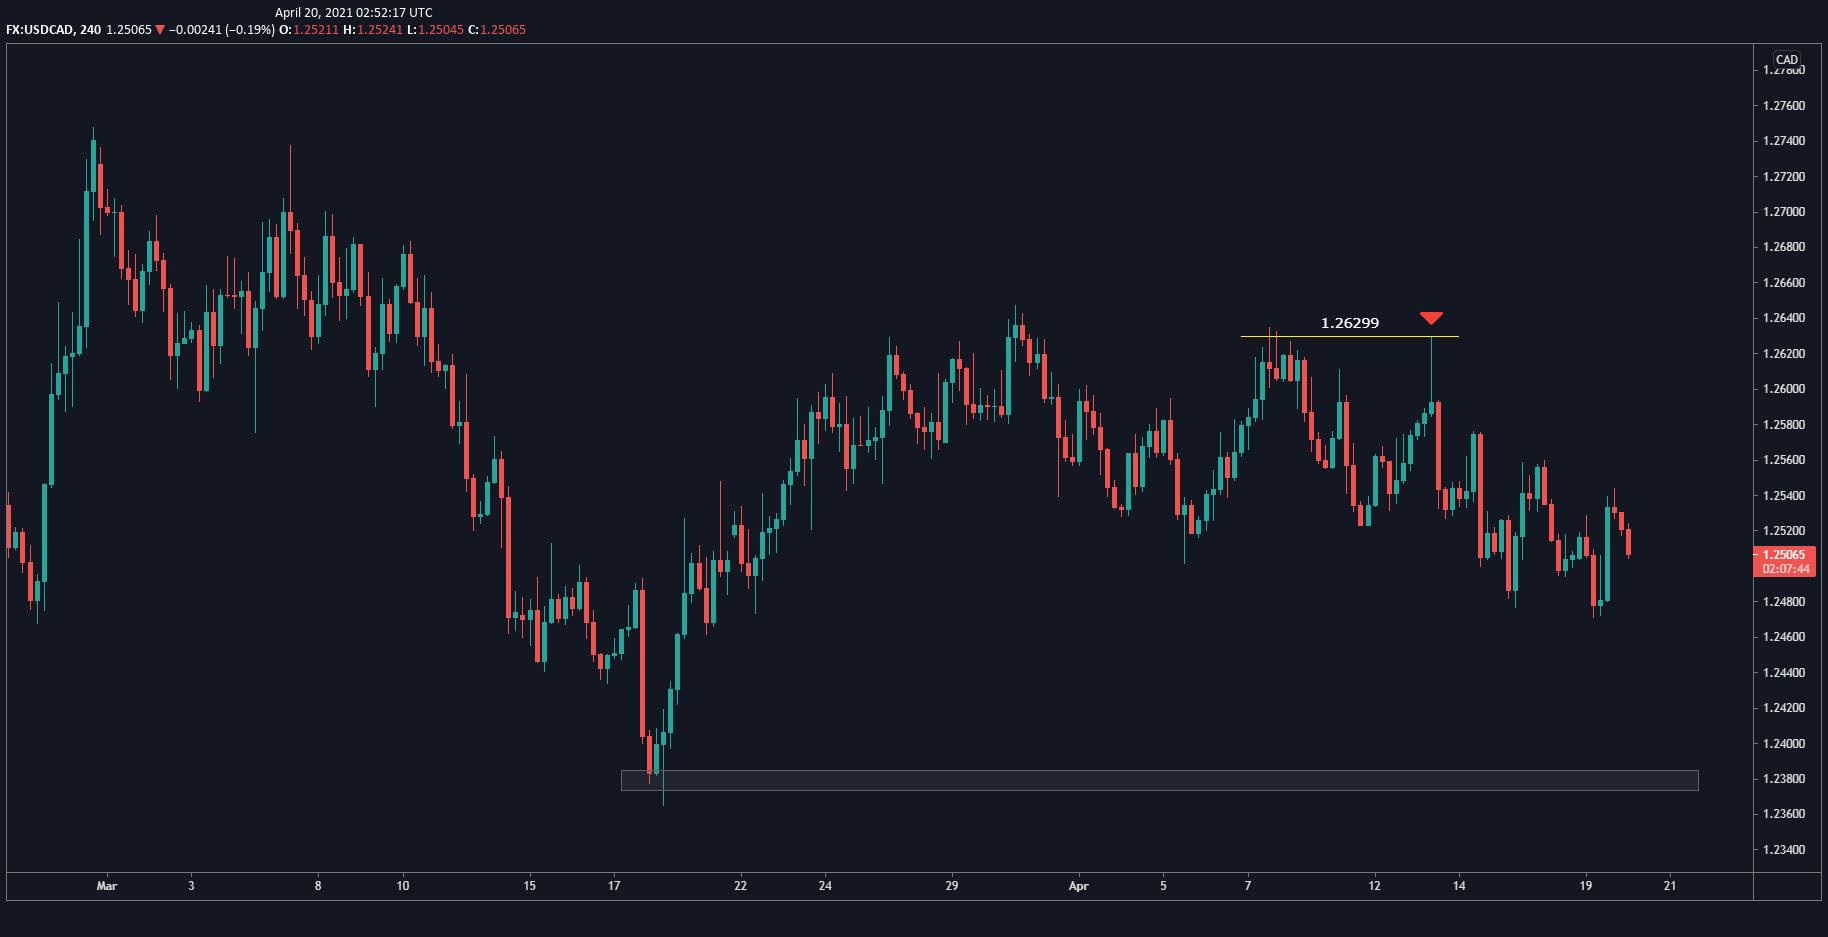
Now let's see the 4-hour chart for the USD/CAD:
The pair is in a long-term downtrend, but that trend is quite messy and hard to get into. The last trade I saw (though I missed it) is marked by the yellow line. It made a resistance and then a clean pin-bar reversal against the resistance. I think there as a good entry there, before the price pushed down. But because the trend is so volatile, with such large retraces, I find it difficult to easily spot trades in this pair. Using moving averages or RSIs to help you identify entries might be a good idea. In the meantime, I'm bearish USD/CAD.
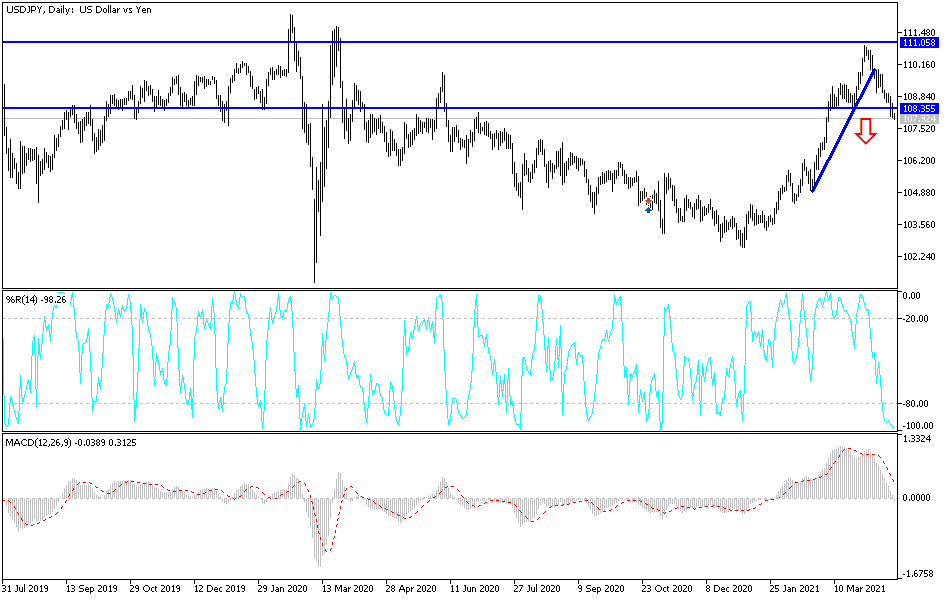
Lastly, let's look at the USD/JPY, which is looking interestingly bearish:
This head and shoulders pattern may not be as clean as that of the AUD/USD, but it did breach the neckline. As it was trending down, I thought it would stall at the support level and go back up. Instead, it shot right through it, then made a bullish candle to come back up to test the support level as resistance and sold off immediately. Therefore, I'm bearish USD/JPY.
Final thoughts:
If a chart isn't clear to you, for whatever reason, stay away. It's not worth risking your position because of a trade that's unclear. In fact, out of all the majors, there are only about 2-3 trades that I actually want to take. So rather than try to jump in without clarity, try a different timeframe or wait until the chart clears up enough for you to make a more confident decision.
Also, always mind your risk. Ask yourself: have you set a stop loss? Where is your target? Are you getting positive risk/reward ratios? You want to make sure you practice effective risk management so you can trade safely and profitably.

