The most important thing to understand when it comes to trading a financial market is whether you are in a trend or not. Beyond that, you also need to understand whether you are in an up or down trend. As a rule of thumb, downtrends do tend to move much quicker than uptrends, which is why in the stock markets there are people who specialize in short selling only.
Forex isn’t going to be as biased, because in order to short a currency, you need to buy another one. Nonetheless, downtrends are an opportunity to take advantage of a clear trend and therefore profit from larger moves. Being on the right side of the market of course is the most important thing you can do, because although you can make money going countertrend, it is much more difficult to time when the market is going to move against the prevailing momentum.
Some tools
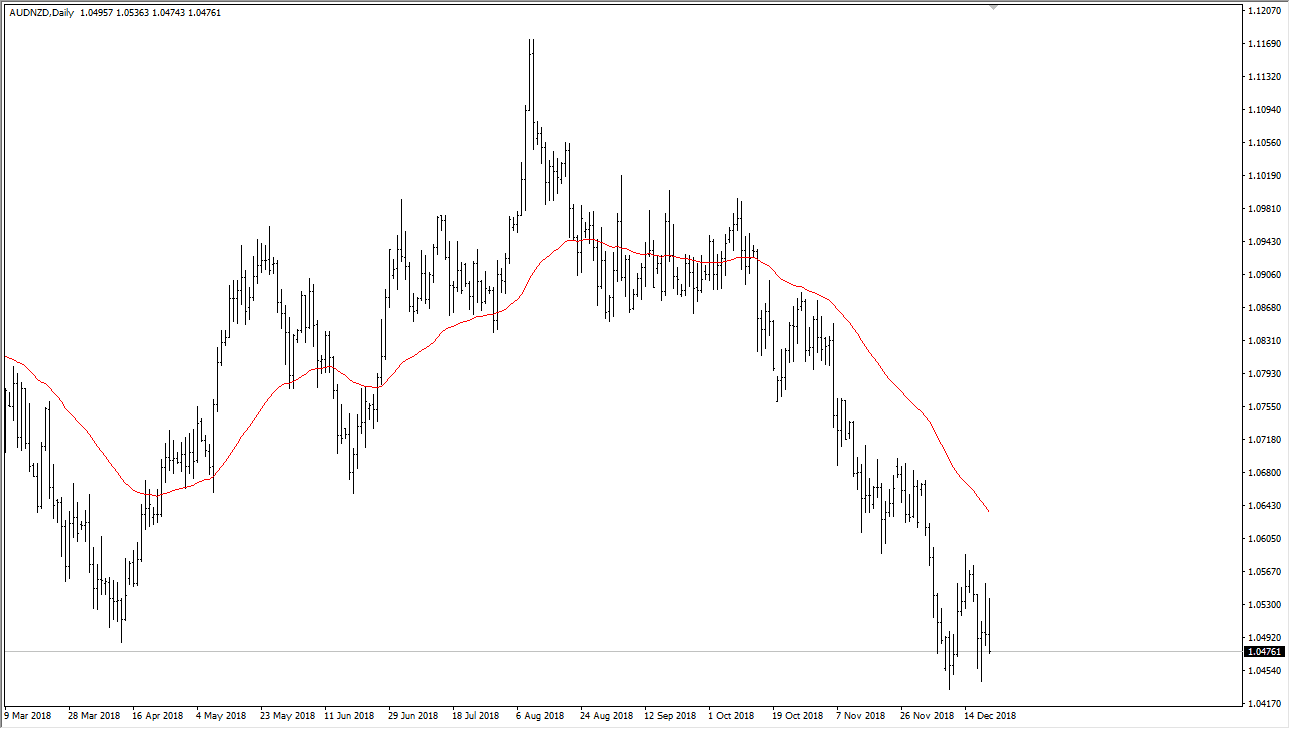
When it comes to trading with the trend, in this case a downtrend, there are couple of tools that you can use to determine the trend and therefore be on the right side of the market longer-term. The most obvious would be a moving average, which is a very common indicator for traders use. It simply tells you the average price over a certain amount of candlesticks, showing whether the prices are rising or falling. In the chart just below, you can see that the AUD/NZD pair is most certainly in a downtrend, as the red 50 day moving average has turned lower and continues to fall. By using that indicator, you can stay on the right side of the market as you can see every time the market rallied a bit, it’s sold off again since turning lower. I would also point out though that there were a couple of times when the moving average was relatively flat, suggesting that there is no trend. This preceded the major downtrend that we see on the daily chart. You can also do multiple timeframe analysis, using higher time frames to dictate what you do. For example, you could use a weekly chart and noticed the direction of the market, perhaps using a moving average like I just suggested, or simply looking at pricing and what it’s been doing over the last year or two. Then, you scale down to the daily chart, and wait for the market to rollover and start going lower as it goes with the longer-term downtrend. You continue to do this until your directions all line up in the same way. If you are a four-hour chart trader, then you’re looking for the daily, weekly, and for our charts to all point lower. At that point, you know that the market is moving in a downtrend, so you know what you should be doing.
Trading the downtrend
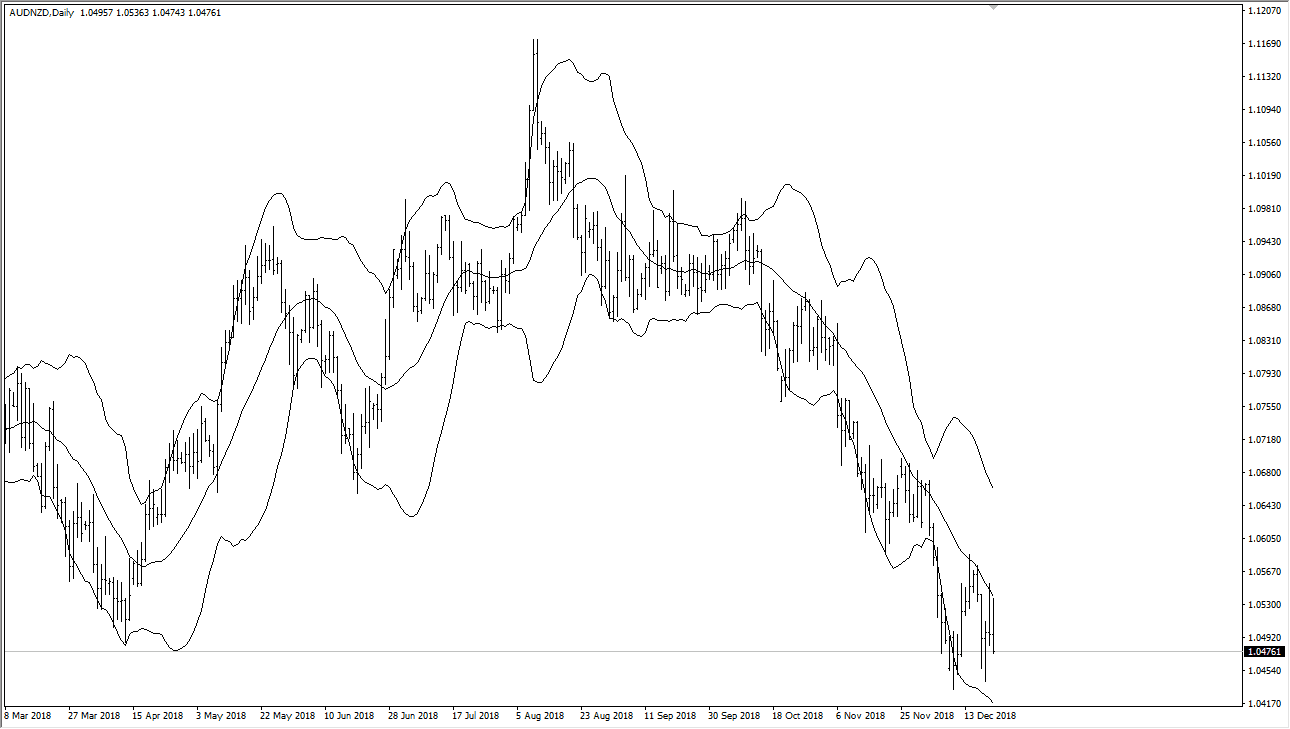
One of the biggest mistakes you can make is trying to fight the overall trend. Because of this, if you find yourself in a downtrend there is zero reason to start buying. I understand that some traders out there will tell you to go back and forth and you try to earn every tip you can, but from over a decade of trading experience I can tell you that psychologically that’s a very difficult to do, and of course it’s dangerous. Once you recognize this, you simply look for selling opportunities. Now that we have established a downtrend, I have put the Bollinger Bands indicator on the same daily chart of the AUD/USD pair, and you will see that once the market started to fall, the 20 moving average, which of course is the middle line on the Bollinger Bands indicator, has offered dynamic resistance. Every time we have rallied a bit, the sellers have come back in that area. If the market is following a moving average or an indicator this well, there’s no reason to fight it. You simply sell every time it touches that level. True, eventually it will go against you, but the idea is to make more than you lose, and if you can do that - congratulations, you’re a winning trader.
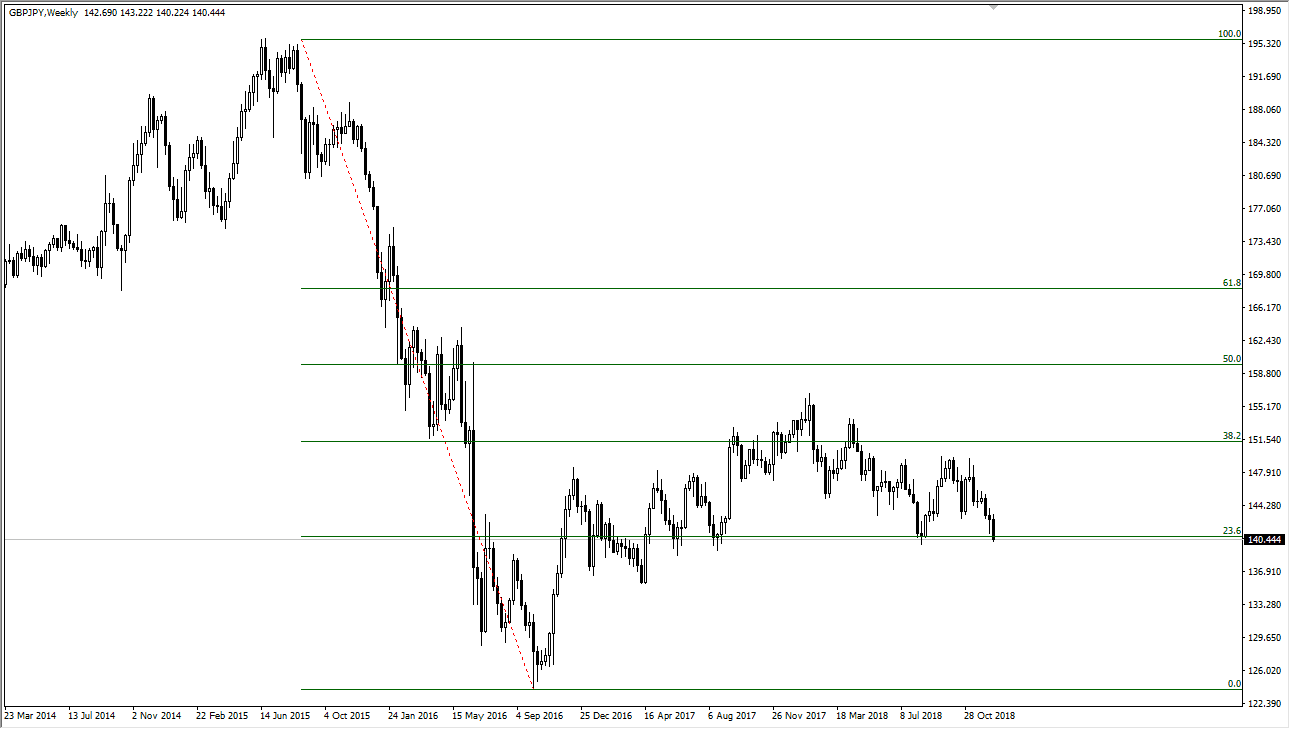
Another way to trade to trade a trend is to use pullbacks to your advantage. For example, in the chart below I have a Fibonacci retracement tool drawn out on the weekly GBP/JPY pair. We obviously are in a downtrend, simply looking at the chart will tell you that. By following the way we have, and then bouncing significantly, longer-term traders are looking for an opportunity to start shorting again. Once we reached the 38.2% Fibonacci retracement level, we ended up forming a massive negative candle before falling over again. By using the Fibonacci retracement tool, you know that other traders will be paying attention in these areas. The main three areas that I will pay the most attention to are the 38.2% level, the 50% level, and the 61.8% level. If you can get an impulsive candle that looks like it’s going to continue the trend that one of these levels, you should be paying attention to it. Some traders will use a combination of all of these indicators to put money to work when in this case, the Japanese yen became “too cheap” in relation to the British pound.
A word of advice
Staying on the right side of the trend is the most crucial thing you can do. I cannot tell you how many times I have been bailed out by the market because I may not have made the best entry on a trade, but by going in the right direction and using proper money management, I could ride out the volatility. I would also point out that having as many reasons line up at the same time as possible to start shorting is also crucial, and a winning combination when it comes to trading.
