By: Doug Rosen
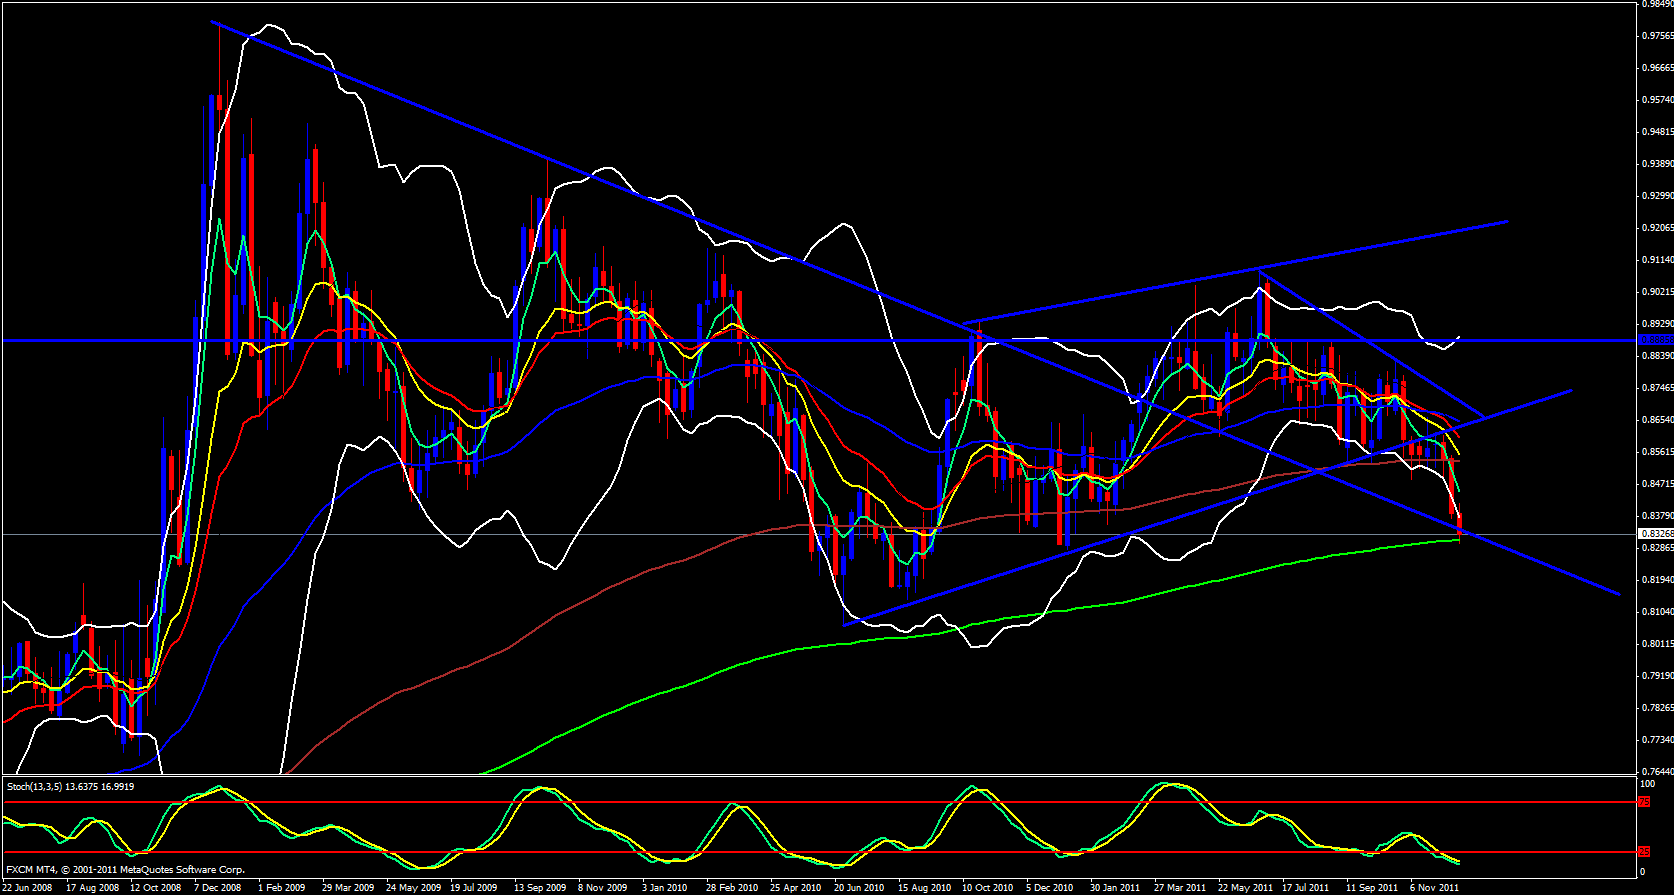
Yesterday the EUR/GBP tanked. 73 Pip drop for this pair is a big range. Of course, this is no surprise since if you read my analysis yesterday I said it would drop, and it did. On the weekly time frame price finally made it down to the 233 ema as I knew it would sooner or later, after all, the 233 ema calls out to price. Remember, price is always either approaching the 233 ema or departing from it. The 233 ema is always the equilibrium for price, the fair market value. Most traders use the 200 but I use the 233 since it is a Fibonacci value and 200 is not. So price made its way to the 233 and bounced as expected since the 233 ema will always cause a reaction due to profit taking.
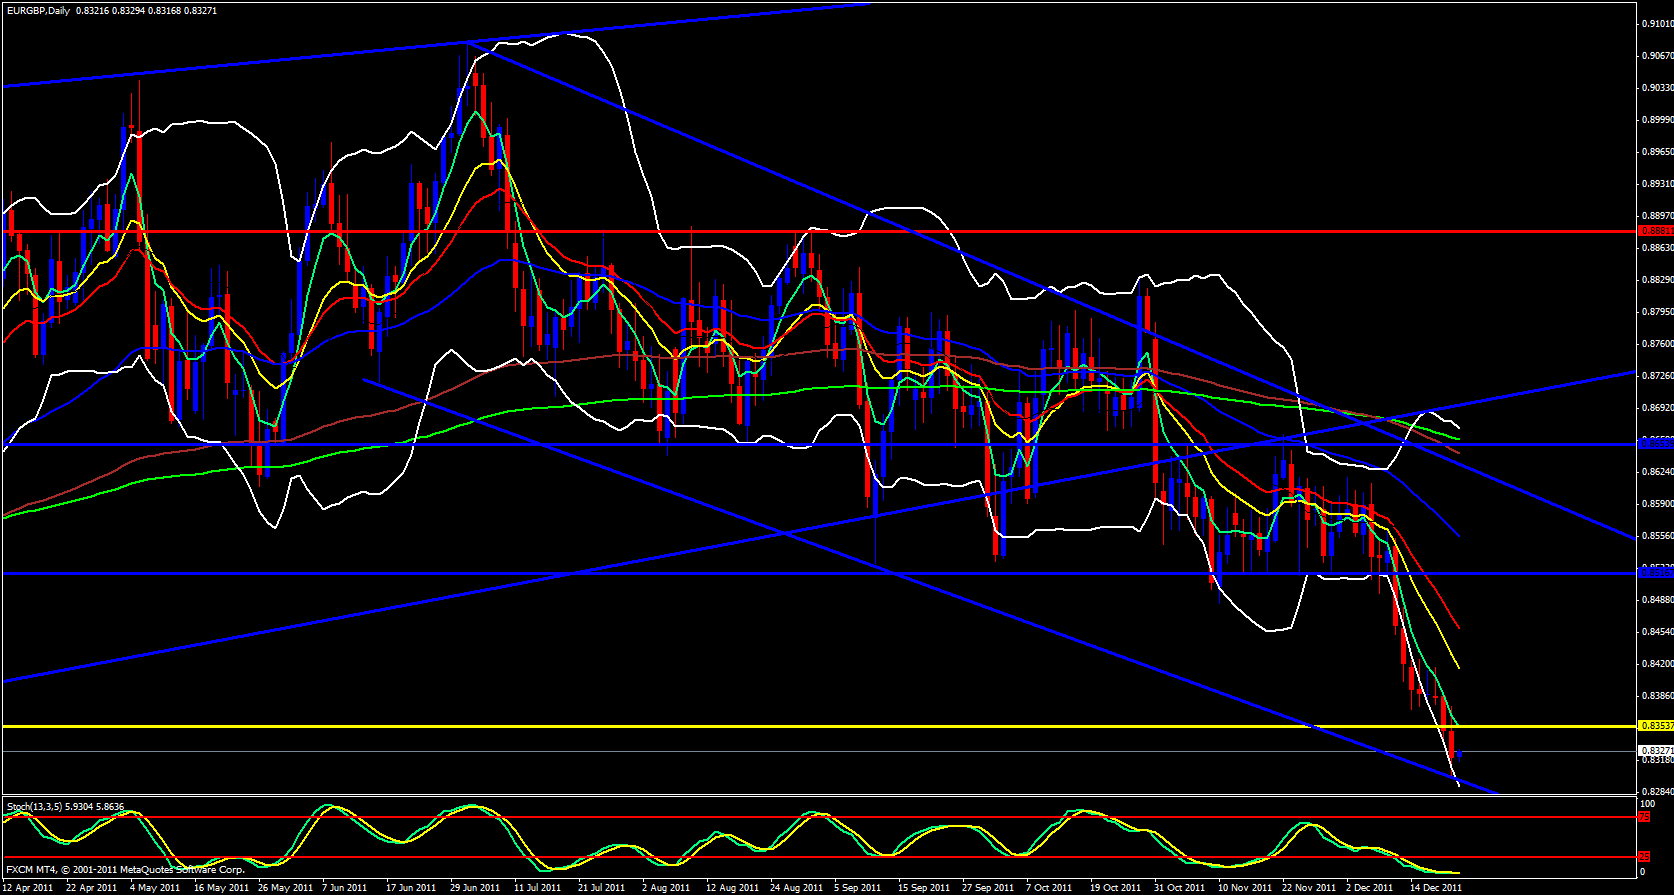
At the same time weekly price touched the 233 and bounced the daily candle touched my lower price cannel line and bounced as well. Now the retracements to the upside should soon begin. The weekly and daily candles need to rise to their respective 5 ema's especially the daily.
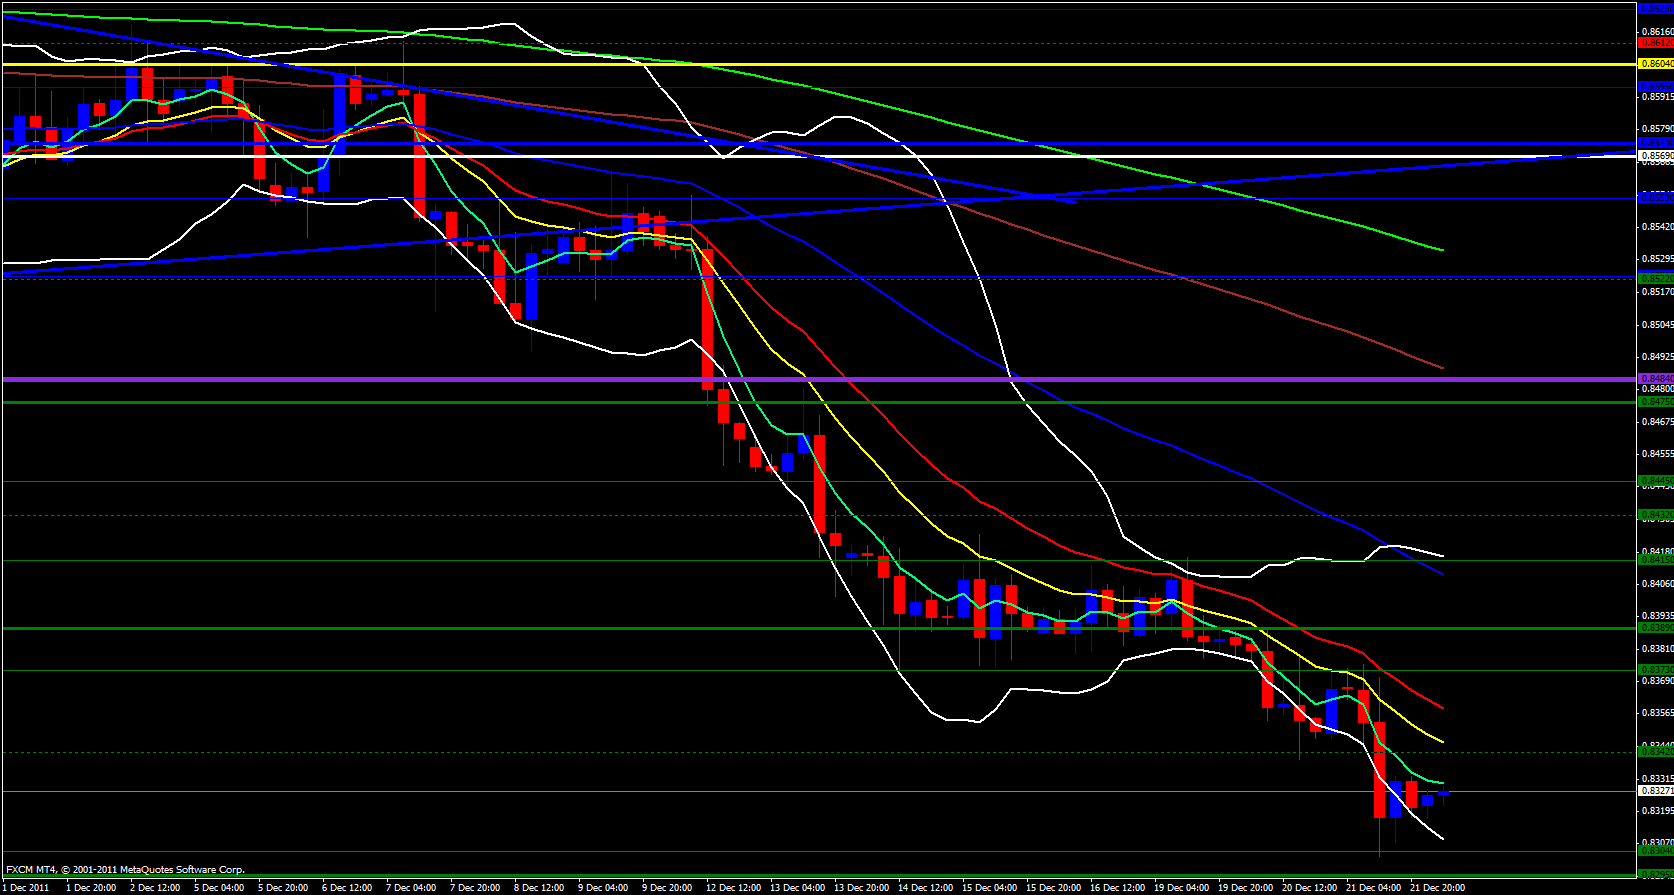
On the 4 hour time frame price is still just below the 5 ema, however, the last few 4 hour candles have shown higher lows so something is up. A trip up to the 4 hour 21 ema is realistic.
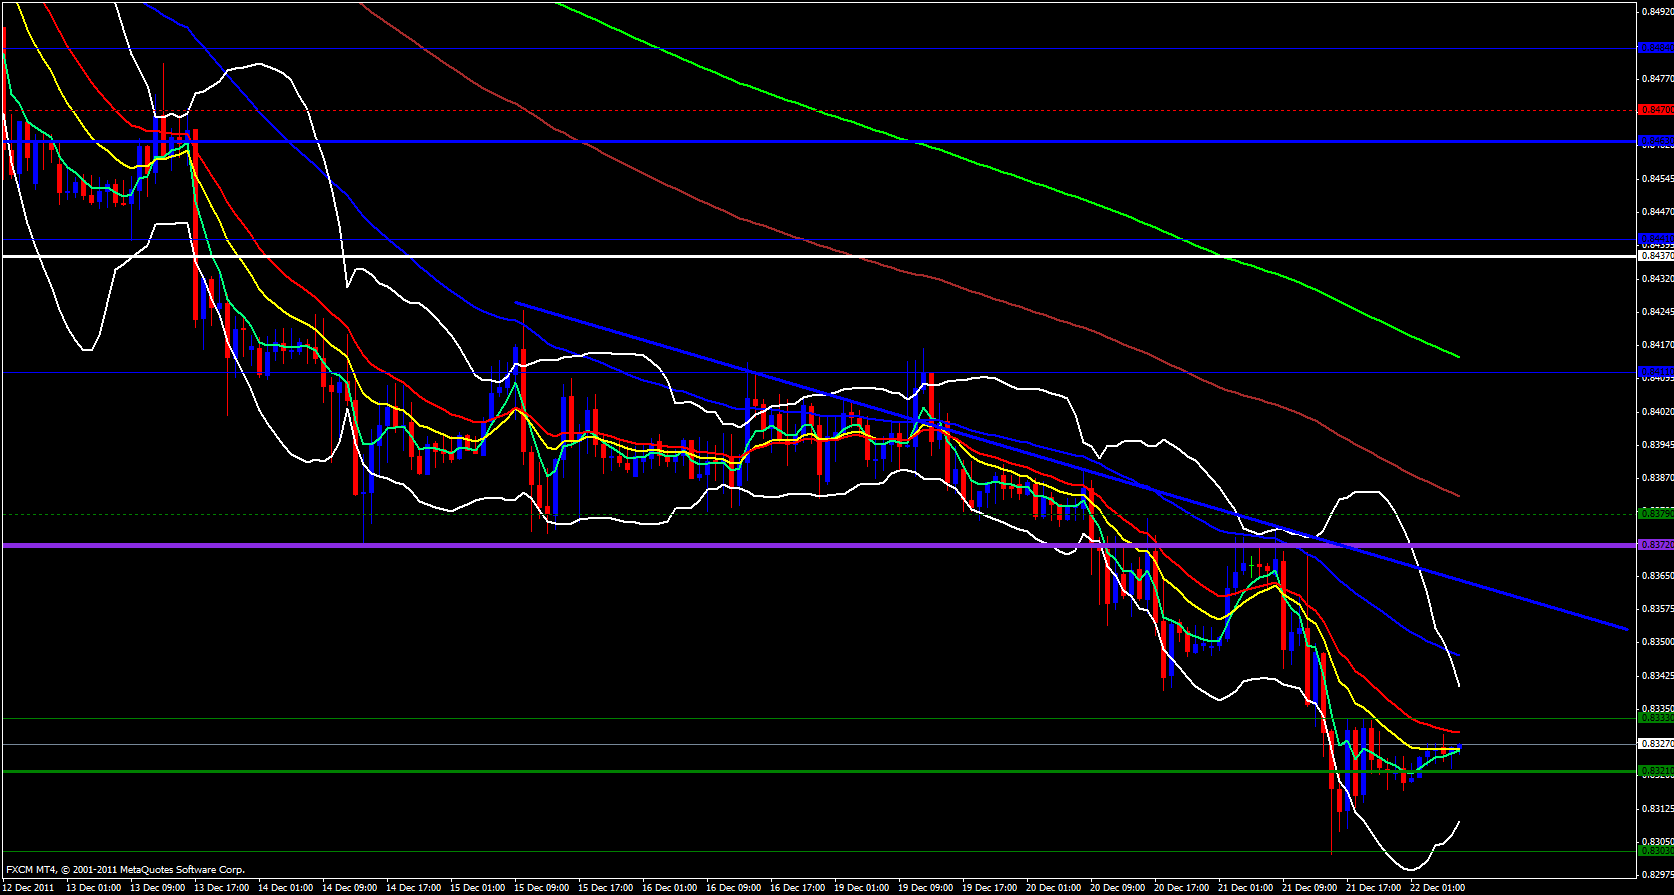
The hourly time frame as well as the 15 minute are rising. A trip up to the .8340 - .8350 area is very probable before further downside will occur.
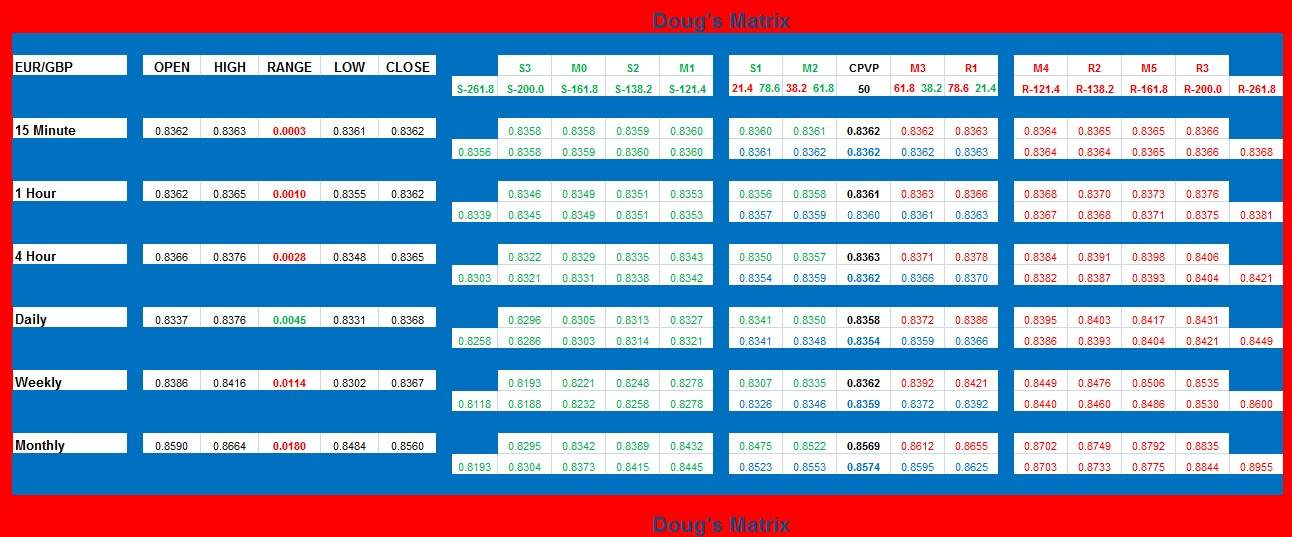
Included in my analysis from now on is my custom made Support and Resistance Matrix of my own personal design. It is complex but will provide you with all the possible support and resistance areas to watch out for. This is strictly a mathematical based system that calculates Pivot Points and Fibs over multiple time frames.

