Last week's analysis concluded by predicting:
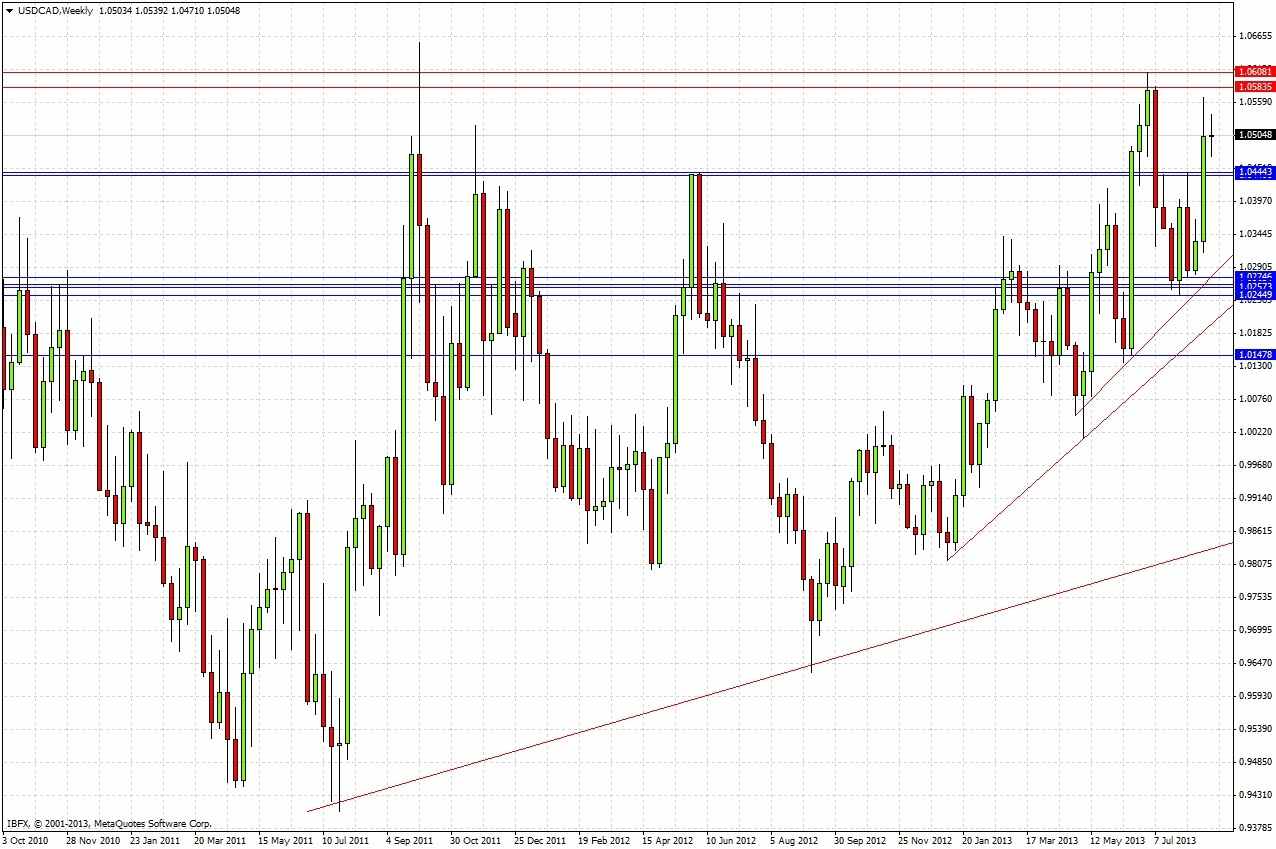
So, for an overall trading plan, for the time being bulls are firmly in control. Momentum is strong so it is possible to trade pullbacks long. The obvious zone to wait for would be a test of 1.0444 which might act as good support. Alternatively, if the price moves very quickly up to the resistance zone at 1.0583, a failed test and a retest of that level could provide a good short opportunity. That zone is part of a high that has held since October 2011.
If you are holding a long, aiming for 1.0575 as a target would be a good idea.
Should price fall very quickly back below 1.0440, which would be unlikely, it would be better to wait for a return to the higher trend line before going long.
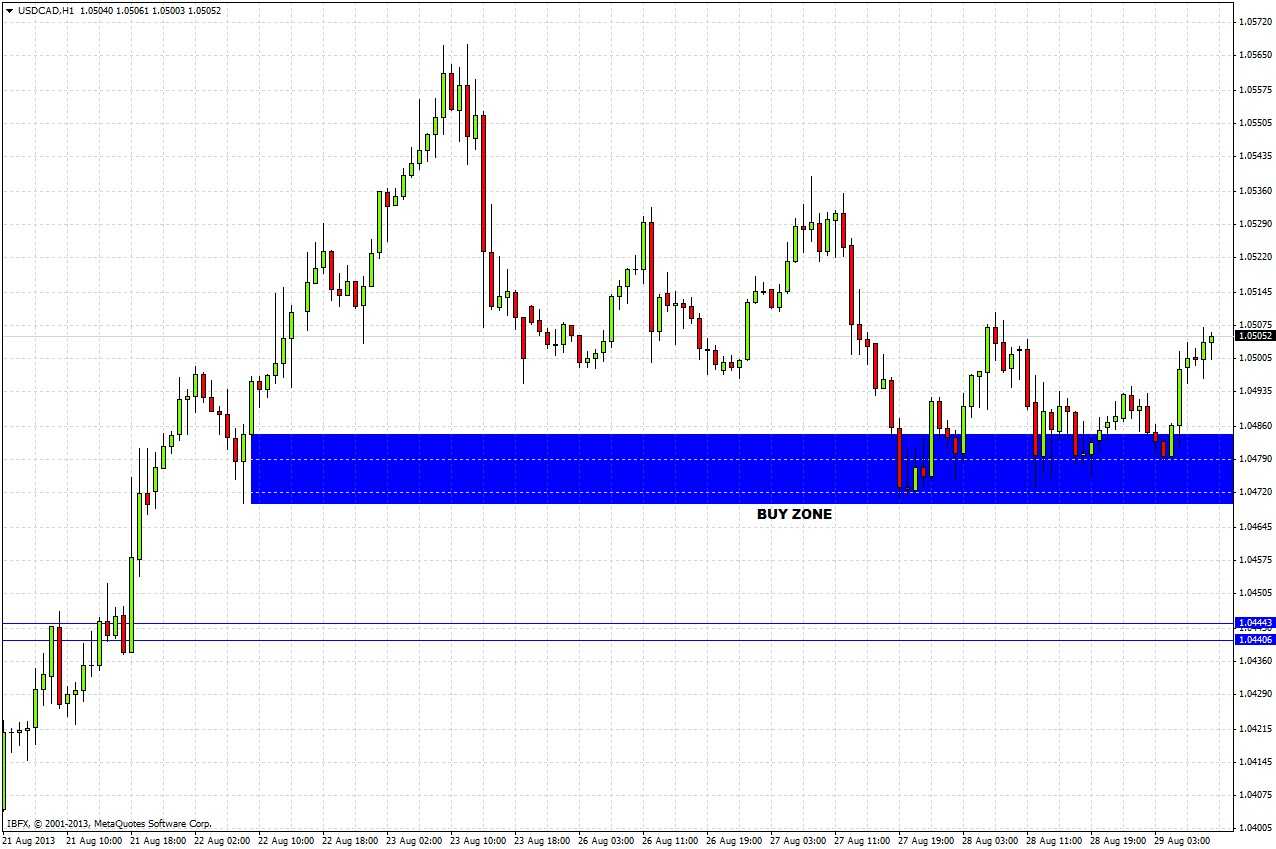
We just had a bullish reversal candle after a pullback on the hourly chart, so this could be a good buy zone for day trading today (watch out for the USD news a bit later).
Let's look at the daily chart since then to see how things turned out
The price action over the last week has been very quiet, with the exception of last Friday's bearish pin bar/hammer. None of the levels mentioned above have been hit: range has been small, although we did get to within just a few pips of 1.0575 where it was recommended to exit longs. If you were holding a long and waiting to exit there though, you would still be waiting if you did not get out after the bearish pin/hammer. Having said that, the prediction worked in another sense, in that it recommended waiting for 1.0444 to initiate any new longs, and that has not been hit yet, so that would have kept you out of this dull market.
The prediction did identify a buy zone on the hourly chart, price did return to this level a few days later and it was good for some long pips earlier this week and also early today, as shown in the hourly chart below:
Looking to the future, the weekly chart does not give us any new information
The daily chart suggests that bullish momentum has been cooling, signified by the slow bearish action after the pin bar/hammer a few days ago at the high close to the next overhead resistance zone, as shown in the daily chart above.
No doubt about it, the uptrend is intact. Logically there should be more to be made on the long side, so the question should be where to look to go long. The advice from last week still stands: wait for a bullish reversal when price reaches 1.0444, or even earlier in the buy zone identified in the hourly chart above. If it never comes and the price falls through 1.0440, wait for the price to stabilise somewhere from 1.0368 to the bullish trend line some pips below that, which looks like a great buy zone.
If we get to last week's high at 1.0567, or even close to it with weak momentum, this is a good area to take long profits and to look for a counter-trend short trade if you want.


