Last week's analysis ended with the following predictions:
1. Solid support at 0.9223
2. Long-term bearish trend is over
3. Price may just rise to 0.9550 without pulling back
4. Overall bullish bias
This forecast worked well. There was no pull-back to the support at 0.9223 and the price rose last week to a high of 0.9527, from which level it fell. The major move was bullish, so the bias was correct.
Turning to the future, let's begin by taking a look at the weekly chart
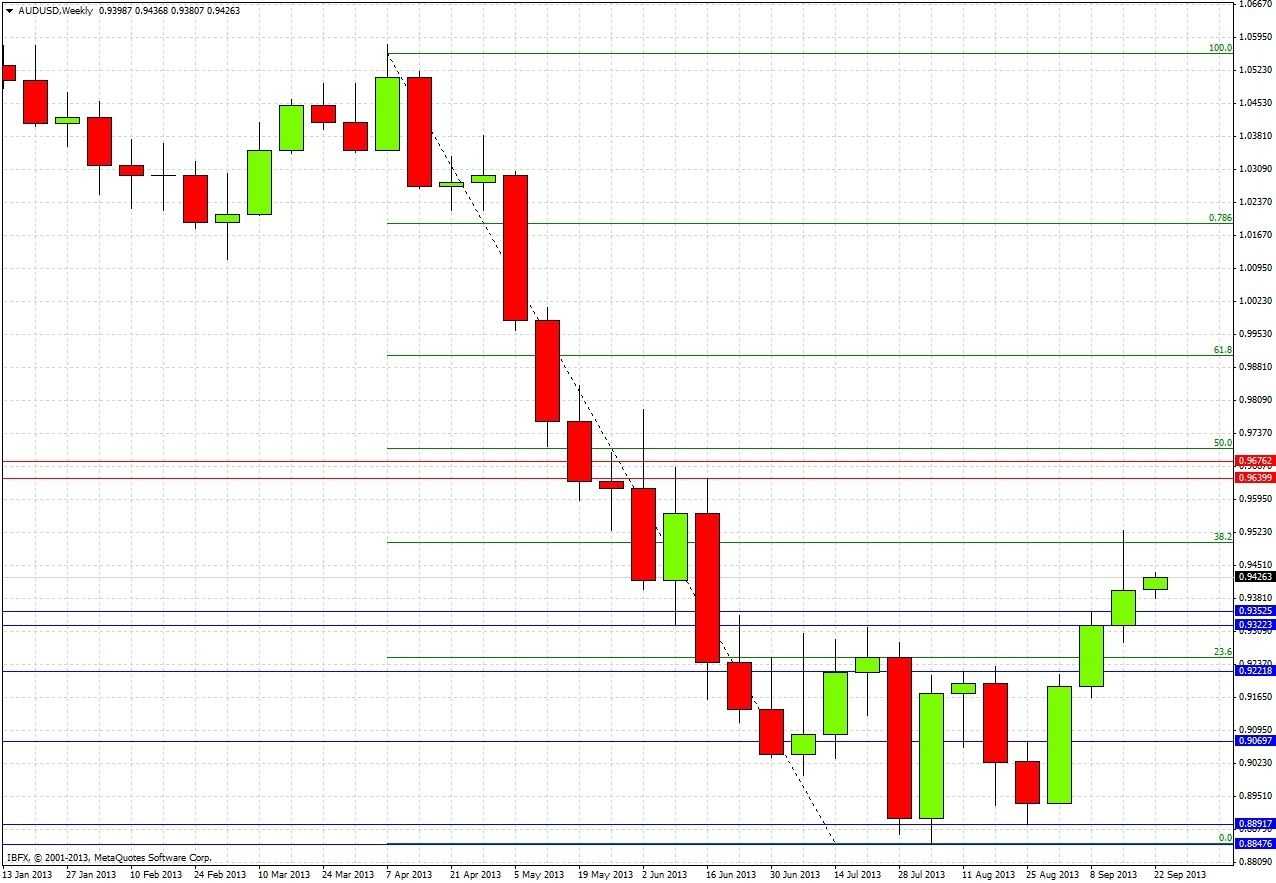
This weekly chart shows that last week closed up, but with a very long upper wick showing weakness in the zone from about 0.9400 to the high of 0.9527, which is close to the upper wick of the bearish reversal candle that formed in June. It appears there is a zone of resistance from 0.9527 to 0.9640.
Let's get some more detail and take a closer look with the daily chart
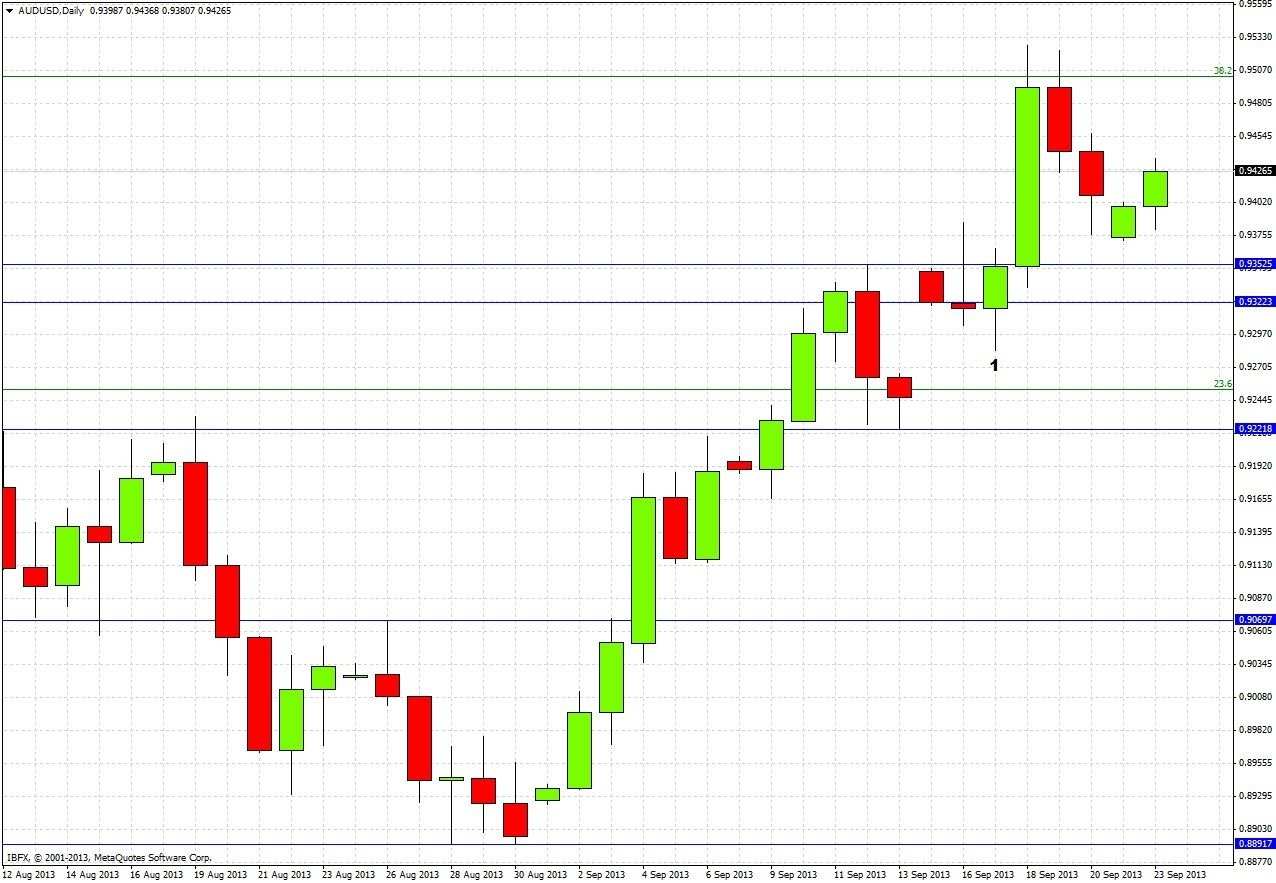
Tuesday's daily candle was a nice bullish reversal candle with a decent lower wick (marked at 1), the candle was a good pointer to Wednesday's strong rise. Thursday and Friday saw a falling off from the high, but so far this week since last night's open we have seen a rise. We can see also that last week's high was very close to and respected the 38% fibonacci retracement of the recent long and strong down move, which sits confluently with a key round number at 0.95.
The question is, what does all this mean for the future outlook of this pair? Nothing has changed much since the analysis one week ago, so the conclusions drawn then can be still valid. The only new development of significance is that we have an idea that the resistance overhead is going to begin at aroud 0.9525, about 25 pips earlier than originally thought.
Down below, the support at 0.9223 still looks just as solid. As the longer-term bearish trend can be said to have ended and bottomed out bullishly, this seems like a great place to look for a long trade on a pull back.
Of course, the zone from about 0.9300 to 0.9350 also looks supportive, and it may not be necessary to wait for the price to fall to a zone below that before going long. It should be worth keeping an eye open around here for bullish action on a shorter-term chart.


