Our previous analysis last Thursday ended with the following predictions:
1. Hard to predict what is coming next, but weak bullish bias
2. Longs look good at 0.9281 and 0.9223
3. If 0.9408 and 0.9365 hold as support, this indicates a more certain bullish bias
4. Daily close below 0.9223 will indicate bearish bias
5. Daily close above 0.9457 will confirm bullish bias
6. Daily close above 0.9527 will confirm strong bullish bias
7. Area from 0.9500 to 0.9525 should act as strong resistance
8. Break of 0.9525 will indicate bullish bias
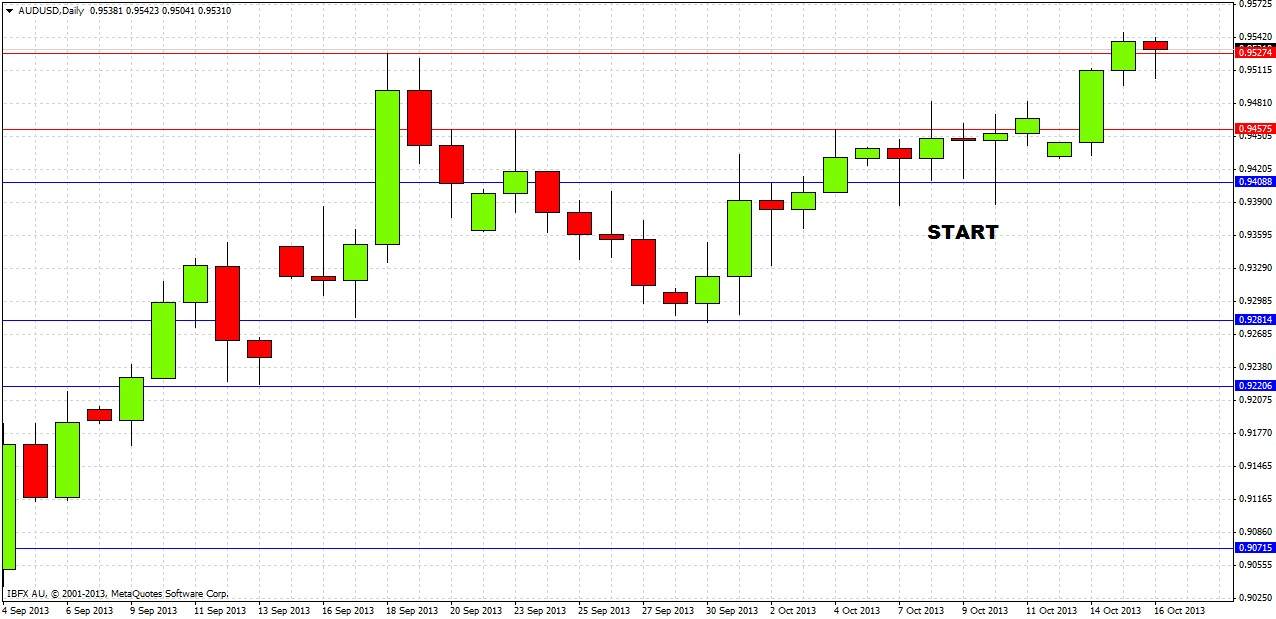
These predictions worked very well as a trading roadmap for this pair, as can be seen from looking at the daily chart:
The price has risen quite steadily, and has not fallen below 0.9388. We can say that 0.9408 held as support and that this did correctly indicate a more bullish bias, as the price rose strongly after the level had been tested several times. Fading this support level, as recommended, would have been a nicely profitable trade, assuming a stop loss of more than 20 pips was used.
Last Friday closed above 0.9457; this was just before a sharp rise so that acted as a good bullish confirmation.
The area from 0.9500 to 0.9525 did act as at least temporary resistance, however yesterday we had a close above 0.9525, indicating a further bullish bias.
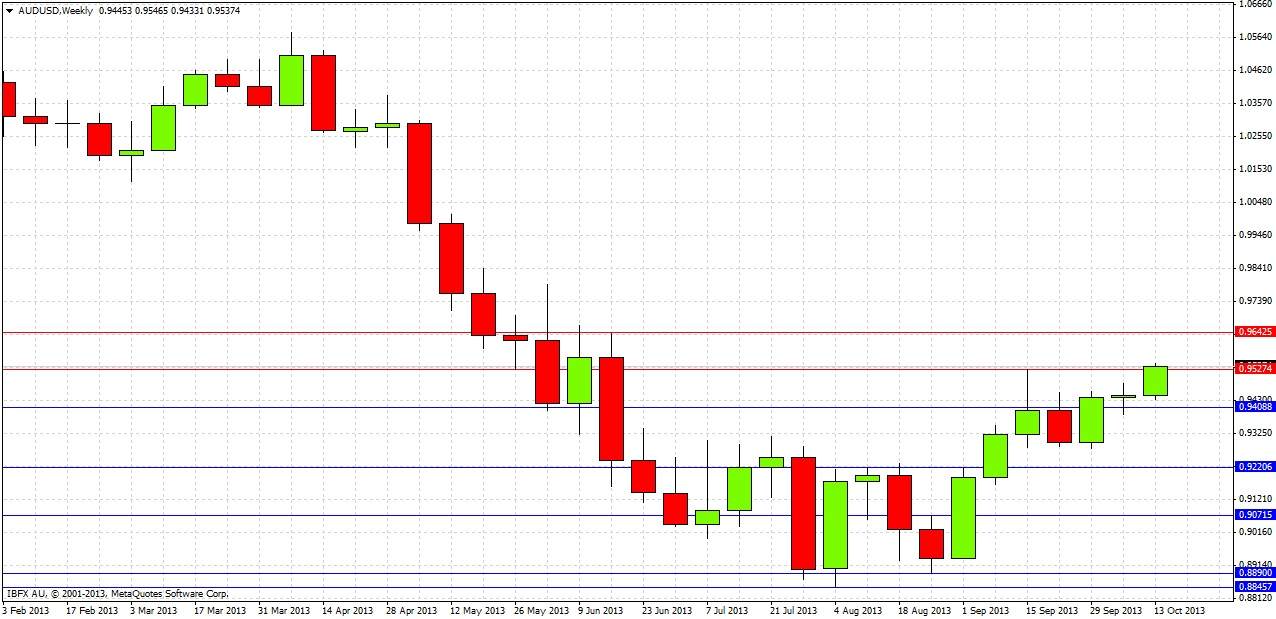
Turning to the future, let's begin by taking a look at the weekly chart
This weekly chart shows that last week was a very small doji candle, showing indecision and a sleepy market. This chart really does not tell us much beyond showing a mild bullish bias. We can see that already, this current week has more directional range than the entirety of last week.
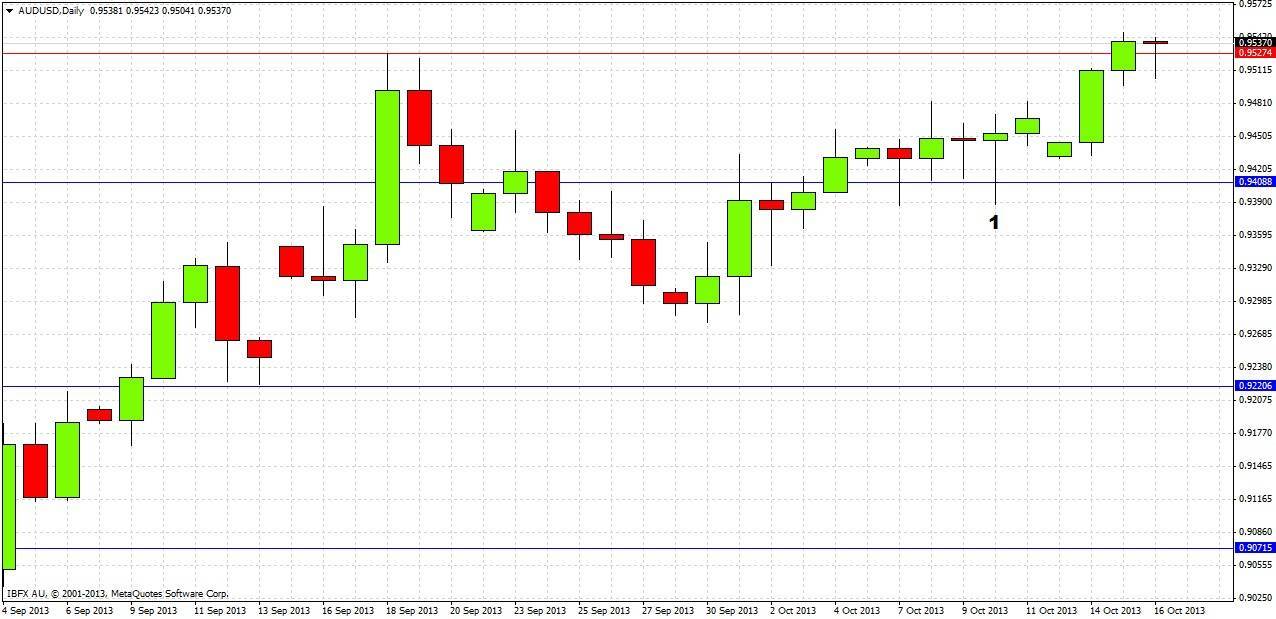
Let's get some more detail and take a closer look at the daily chart
The most important event actually occurred last Thursday, the day of the prediction, marked at (1). There was a bullish outside reversal pin bar, with its wick penetrating the support level at 0.9408. This was a bullish sign and the price did rise from that point. The price has risen fairly strongly over the first two days of this week, and has run into some resistance above 0.9500 as we had expected. The price is currently just above the resistance level at 0.9527, but seems to have stalled there for the time being.
The picture over the coming week does not seem clear. There is no real reason to abandon a generally bullish bias. What is likely to be crucial is how well the price will hold up in this area above 0.9527. If it holds up, it is likely to rise to 0.9600, or even 0.9643. However it is unlikely to break through this zone just yet, there will probably have to be a period of consolidation first. If the price does not hold up, it may fall back down to 0.9400 where it is very likely to find support. A breakdown below this level would be a very bearish sign.
One final note on this pair: if you divide its total range during 2013 by its average hourly range, you get the highest ratio of any of the more prominent currency pairs. The ratio is just under 100. This is a crude measurement but indicates that this pair has been fertile ground for traders this year.


