Our last analysis on Monday last week can be summarized as follows:
1. The 1.0268 level looks like a good high reward, low risk price to go long
2. Breakouts of the 1.0315 and 1.0339 levels will demonstrate the strength and momentum of the uptrend
3. A daily close below 1.0250 and the bullish trend lines will be a very bearish sign, indicating that the long-term uptrend has ended.
Let's look at the daily chart since then to see how things turned out:
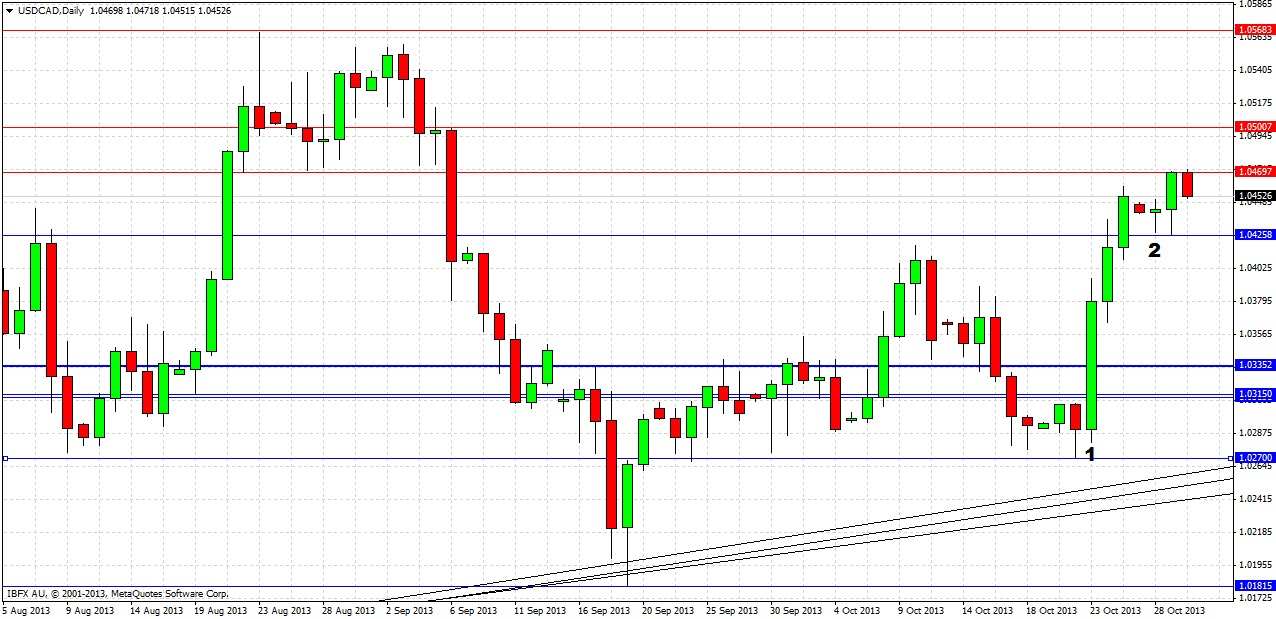
This was a great prediction, although it missed the low by just 2 pips, so pending long entry orders at 1.0268 would not have been hit. However the price did move up about 200 points from that level, overcoming both of the resistance levels mentioned. There was a breakout and retest of the 1.0315 level at the beginning of the London session on 23rd October which also provided a great opportunity to enter long, giving a reward to risk ratio of about 10 to 1 to date if the stop had been placed just below 1.0315. Both of the resistance levels did provide some temporary resistance but were overcome quite rapidly, with 1.0339 proving the tougher nut to crack.
Turning to the future, let's start by taking a look at the weekly chart:
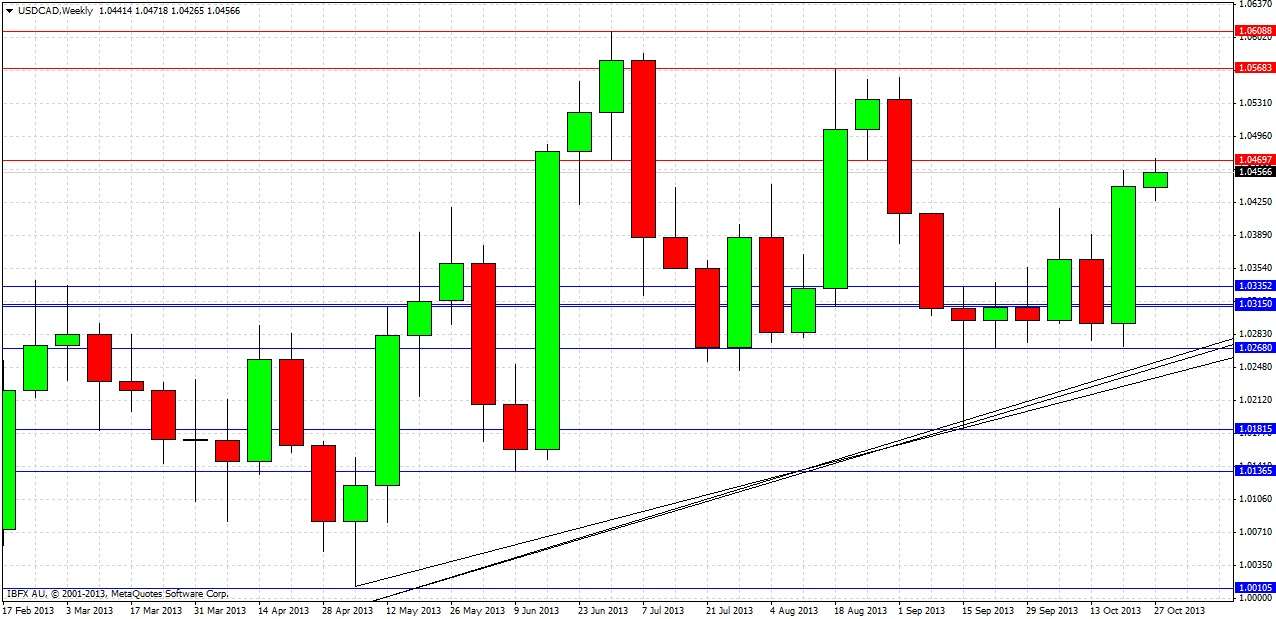
Last week was a strong bullish reversal candle, closing close to its high which has already been broken this week. We have had a break out from the accumulation zone, and have now touched the resistance level at 1.0470 which formerly acted as strong support towards the end of August, suggesting it might take a while to rise beyond this point. Overall, the bullish uptrend is intact, and the trend lines are intact. Despite this, it should be noted we have been making lower highs since August which might have some bearish significance.
Let’s take a closer look now at the daily chart to try to get some more clues:
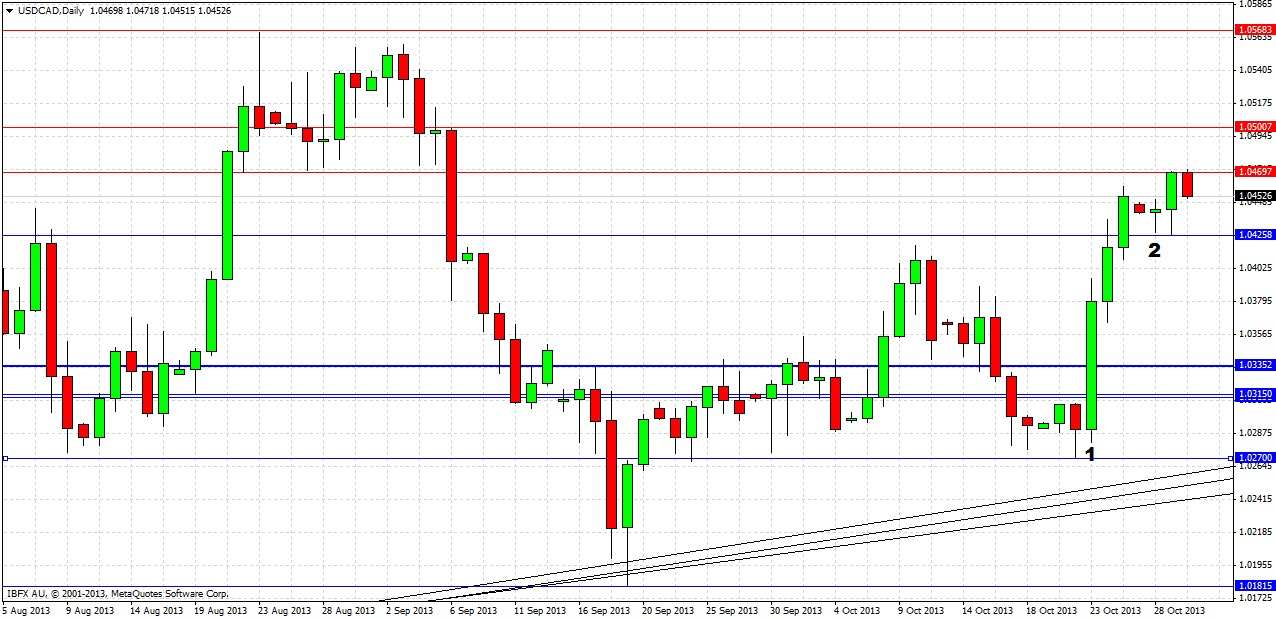
Last Wednesday produced the big bullish move, printing a bullish reversal candle that closed in the top quartile of its range, shown marked at (1). Monday produced an indecisive inside candle, shown marked at (2). This was overcome the next day by another bullish reversal candle, the high of which was broken very early this morning, leading to an immediate fall in the price from the strong resistance level of 1.0470.
Therefore our summary and forecasts are as follows:
1. The uptrend is intact but today looks like a down day.
2. There is strong resistance starting at 1.0470 overhead. The level at 1.05 is also likely to be very strong as a key psychological and supply level.
3. Conservative longs off bullish reversals could be taken from 1.0400 – 1.0425 with profits taken or protected very close to 1.0470.
4. A long touch trade could be taken off any sharp pull back to 1.0339; this level is likely to act as strong support.
5. Bullish reversals off recent daily low prices before 1.0339 could also be nice conservative long trades.
6. Existing longs from the move up should have some profits locked in, if not, it would be wise to take some profit now.


