Last's Monday's analysis ended with only one relevant prediction:
1. It seems that the uptrend is over for the time being, but the 1.3440-1.3500 zone might well continue to hold for a while at least
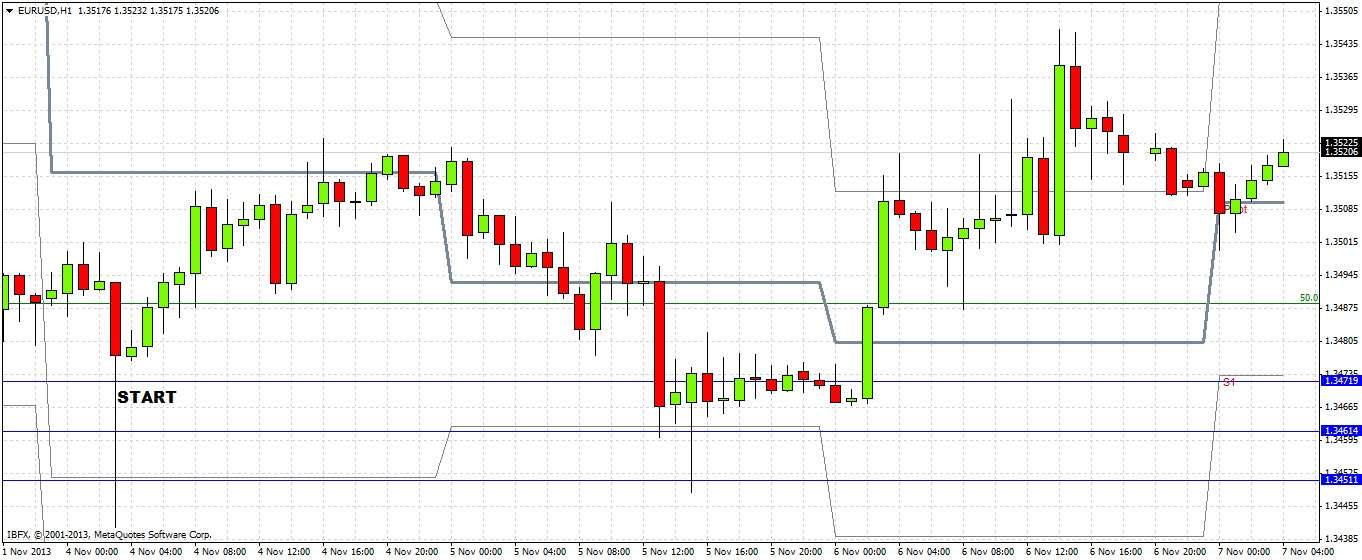
Let's take a look at the hourly chart to see how things actually turned out:
The support zone mentioned has indeed held, having been tested and producing a bullish pin bar followed by an eventual price rise. Turning to the future, let's take a look at the daily chart below:
We can see that the well-established support zone from 1.3440 to 1.3475 has held securely, with Monday producing a bullish pin bar on Monday, with that low of 1.3440 holding so far. Each day this week has produced a higher low, and yesterday formed a bullish reversal candle. However this bullish reversal candle is rather weak, leaving a lot of wick on its top.
It is difficult to predict the likely next moves. A period of weak bullishness / consolidation is probably likely. Traders holding longs should look to lock in profits or take partial profits should the price rise to 1.3574. A bearish reversal candle on the 1 hour chart at this level could be a good bet for a conservative short trade. A bullish reversal candle touching the area between 1.3470 and 1.3440 could be a good bet for a long trade.
We need to see a sustained break above 1.3580 to be confidently bullish, or below 1.3440 to be confidently bearish.
A break below 1.3440 could see price descend all the way back down to 1.3100.
No overall bias, if any bias has to be held, slightly bullish.


