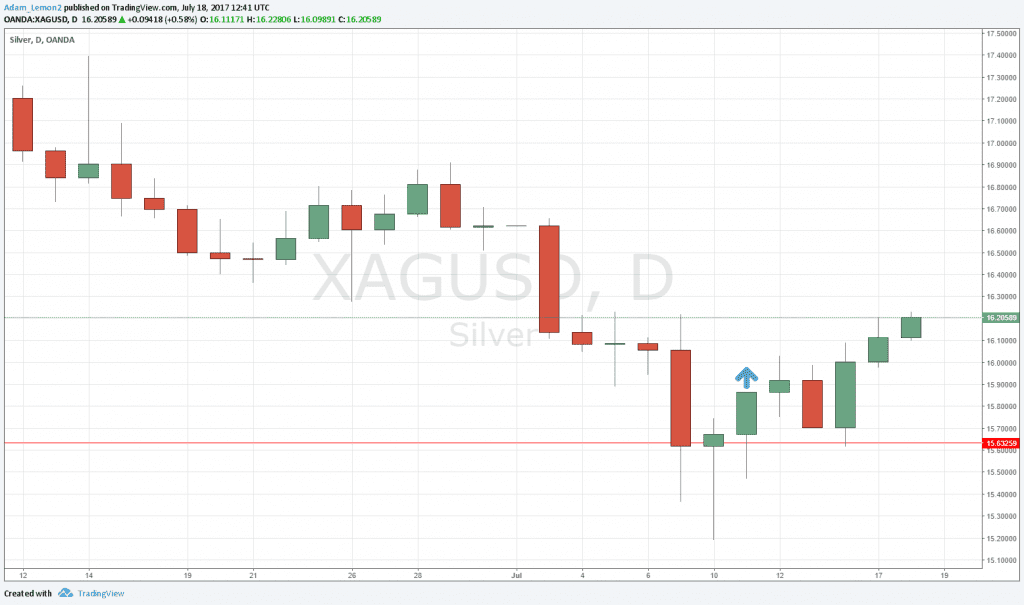
About one week ago, I entered a long trade in Silver (Silver against the U.S. Dollar, to be precise). I entered due to the two usual reasons why I might take a trade in a commodity being present.
First, the price had hit a key support or resistance level which was an inflective price extreme, which in this case was $15.63 which was a 1-year low price. Secondly, there was a strong bullish bounce which occurred in this price area, indicating a probable trend change. I find with commodities, trading qualified bounces from extreme levels is the most profitable approach, in the absence of extremely strong and well-defined trends.
Now that one week has elapsed since the trade entry, it is a good idea to check out how the trade is going. With long-term trades which anticipate trend changes, it is important to give the trade at least a week to develop before you judge it. It is very easy to get “shaken out” of such a trade too early. Trend changes don’t usually happen clearly all at once, in a single day. Typically, there is some turbulence, with the trade spending a while in negative territory, and then often falling back down into it after advancing. This is why it is important to sit tight.
I entered the trade at $15.87, just above the high of the third candlestick in the LOP (low inflection point) pattern shown in the chart below. The entry level is indicated by the blue up arrow within the chart image.

Five days later, it can be said that the trade is in profit and doing well, with a positive outlook. The price initially rose a little higher, as indicated by the first candlestick after the entry, which was a doji. The price then fell in a retracement, but what was very encouraging was the was the retracement was stopped at the original key level of $15.36. As soon as the price reached that level, it began to rise with reasonable strength. This is a good sign, as it shows the level is meaningful and effective, as it has clearly been respected by the market again.
It would not be surprising if the upwards movement runs out of steam, at least temporarily, between $16.22 and $16.36. This is the area of several previous highs, as well as lows from previous price action, which can still be seen in the chart above. However, even if the price does stall there, it will be important to exhibit some patience and not exit too early.
